Yield intelligence, field by field
Six integrated tools built around one question: what will your fields yield this season?
Six tools, one platform
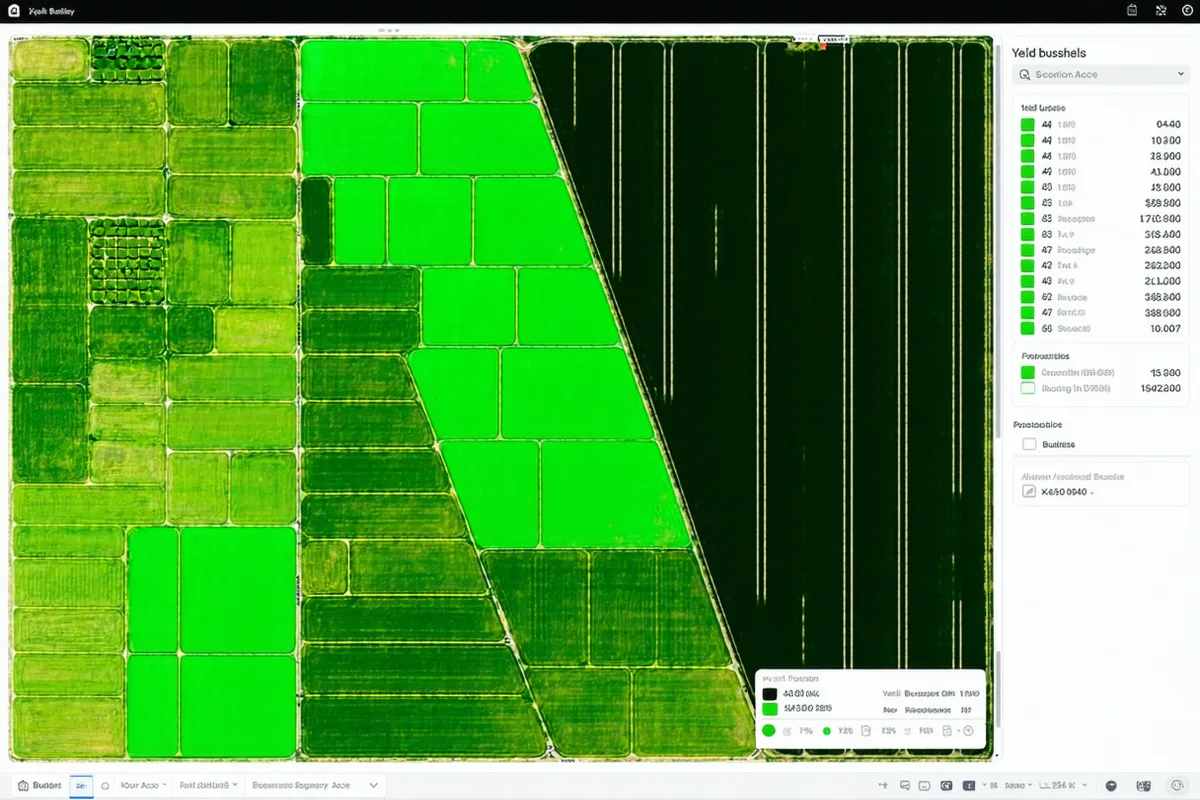
Yield Forecast Map
Per-field bu/ac projections updated every 7 days. Each field polygon is color-coded by yield tier — from high-potential dark green to flagged-stress amber. Export as PDF with a full field list and current estimates, useful for lender conversations, grain marketing decisions, or your agronomist's pre-harvest review.
Field Health Score
A single 0–100 composite score per field, built from NDVI canopy density, heat and drought stress event history, and GDD accumulation relative to seasonal norms for your crop. Updates weekly. Fields trending below their yield potential are flagged automatically — so you know where to point scouting effort before a problem compounds.
Input Optimizer
Nitrogen timing recommendations calibrated to your field's projected yield potential — not a flat calendar date. When a field's yield potential model indicates a strong filling period ahead, the optimizer suggests earlier or higher side-dress N. When stress has already reduced potential, it prevents wasted inputs. Available for corn fields on Grower and Agronomist plans.
Season Timeline
A growing degree day tracker with predicted phenology milestones — tassel, silking, R3, flag leaf, heading date — for all four supported crops. The timeline updates weekly with the latest GDD accumulation and flags any deviation from expected progression. Useful for timing applications, scouting, and harvest logistics.
Alert Feed
Weather stress alerts, disease pressure windows, and yield-impacting events pushed to your email or phone. Alerts are field-specific: a heat event that affects your north fields but not south fields will flag only the affected fields. Alert categories include heat stress at pollination, drought stress windows, frost risk for wheat, and above-threshold rainfall events.
Harvest Report
End-of-season summary report comparing actual combine yield monitor data against season-long Acreweave forecasts. Includes field-by-field breakdown, best-performing fields, accuracy analysis, and agronomic notes from your season timeline. Export as PDF. Available on Grower and Agronomist plans after harvest data is loaded.
Works with your existing yield monitors and field records
Import yield monitor history to sharpen next-season model calibration. Acreweave accepts standard export formats from common farm management platforms. Your field data is used only to calibrate your own forecasts — we do not aggregate or resell grower field data.
Your forecast in your pocket
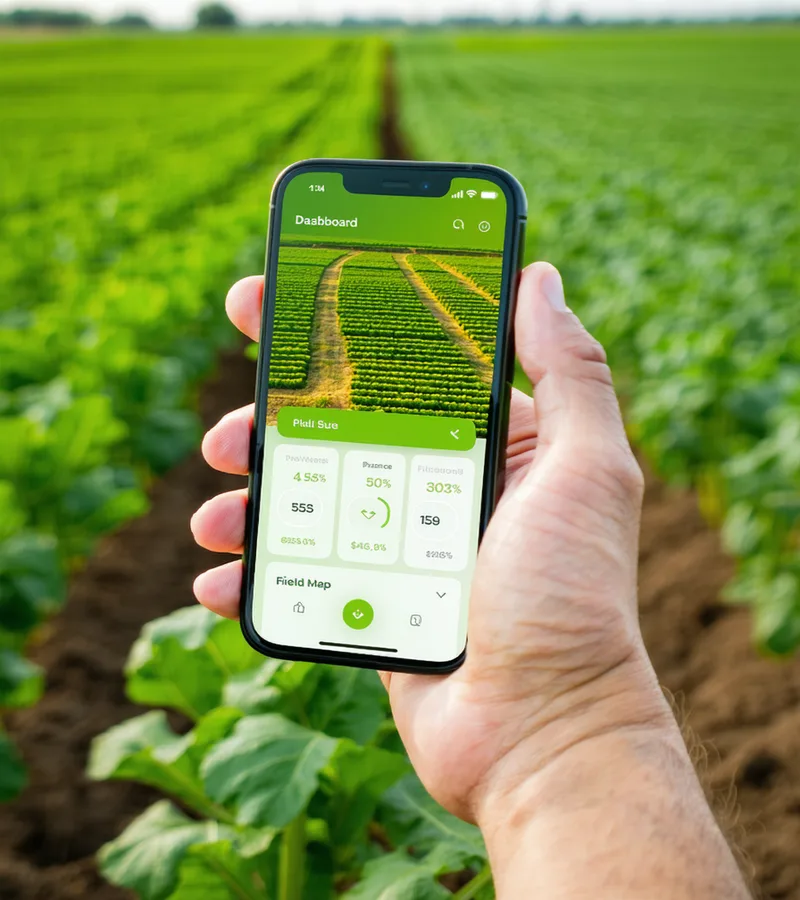
The Acreweave web app is fully responsive — sized for a phone screen in the cab, a tablet in the farm office, or a desktop in town. Check the latest field health scores, pull up your GDD timeline, and export the yield map before a meeting with your lender or grain elevator.
- Push alerts to email or SMS
- Full yield map on mobile viewport
- PDF export from any device
Start with 14 days free. No credit card.
Set up your fields in under 10 minutes. Your first yield forecast arrives within 48 hours.