From satellite pass to field forecast
How Acreweave fuses Sentinel-2 imagery, SSURGO soil data, and GDD accumulation into a per-field bu/ac projection — updated weekly from early canopy through harvest cut.
Three layers of field intelligence
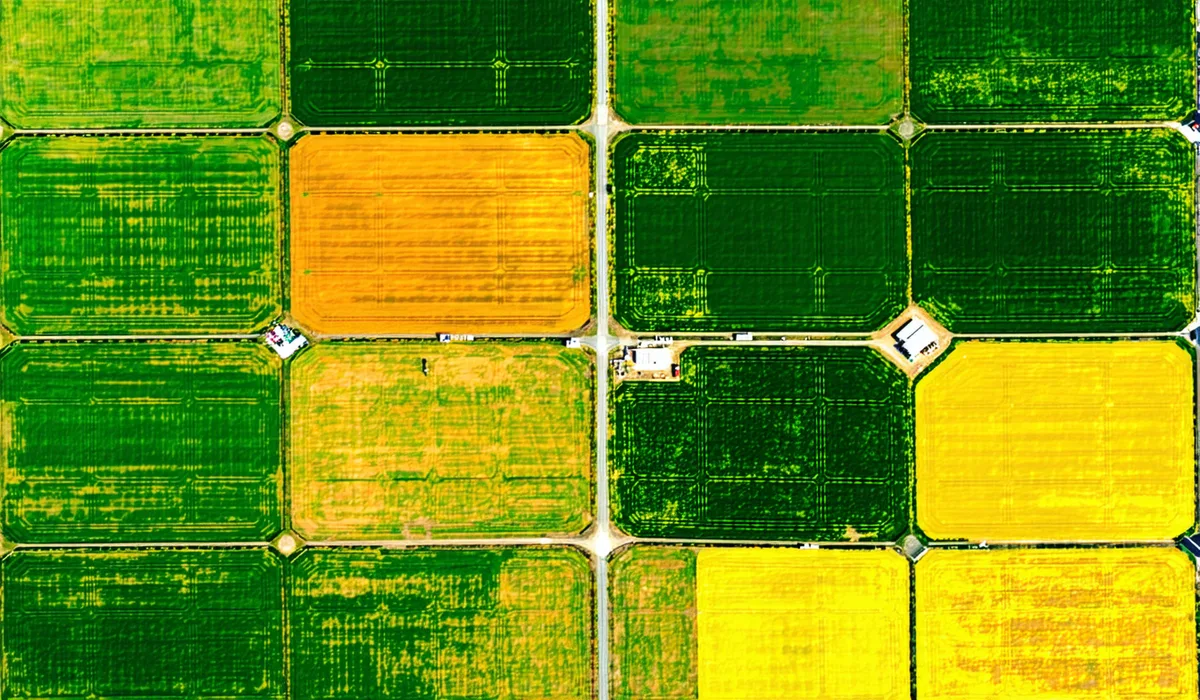
Multispectral satellite
Sentinel-2 and Landsat-8 passes provide weekly 10m resolution NDVI, EVI, and canopy reflectance data across all enrolled fields.
Local weather + GDD
We pull growing degree day accumulations from the nearest ASOS weather stations, fused with high-resolution gridded precipitation data.
Soil texture model
SSURGO and gSSURGO soil survey data provides the field-specific water-holding capacity and CEC parameters the growth model needs.
Agronomic model calibrated to Central Valley and Midwest conditions
Heat unit accumulation + canopy closure
Corn yield potential is primarily set by GDD accumulation from planting through silking. Our model integrates cumulative GDD with weekly canopy NDVI readings to estimate ear count and kernel fill progress. We separate the pre-tassel phase (ear rows set) from post-silking (kernel weight) for separate uncertainty bounds.
Pod-count estimation from R3 canopy signals
Soybean yield is set at pod set (R3). Our model identifies R3 timing from canopy closure rate and GDD, then integrates pod fill stress exposure through R6. The pod-count layer uses canopy closure timing to estimate pods-per-plant, which we validate against yield monitor data from enrolled fields.
Flag-leaf + lint accumulation models
Winter wheat yield is primarily set at flag leaf stage. We track heading date from NDVI transition timing, then apply a grain-fill degree-day model through black layer. Cotton lint accumulation uses a BBCH-stage calendar tied to boll opening timing from canopy reflectance in SWIR bands.
Validated against 3 seasons of combine yield monitor data
After each harvest, enrolled growers upload their combine yield monitor files. We run the season-long forecast against actual cut data field by field. Here's where the model stood after three seasons of validation — 2022, 2023, and 2024.
Accuracy measured at mid-season — V10 through R1 for corn, R3 for soybeans, flag leaf for wheat. Results vary by field conditions, hybrid, and management practices. Validated against yield monitor data from enrolled fields only, not USDA NASS county estimates.
Start with 14 days free. No credit card.
Set up your fields in under 10 minutes. Your first yield forecast arrives within 48 hours.