Row-crop prediction built for your crop
Calibration details, model inputs, and accuracy benchmarks for each of the four row crops Acreweave supports.
Row crop 01
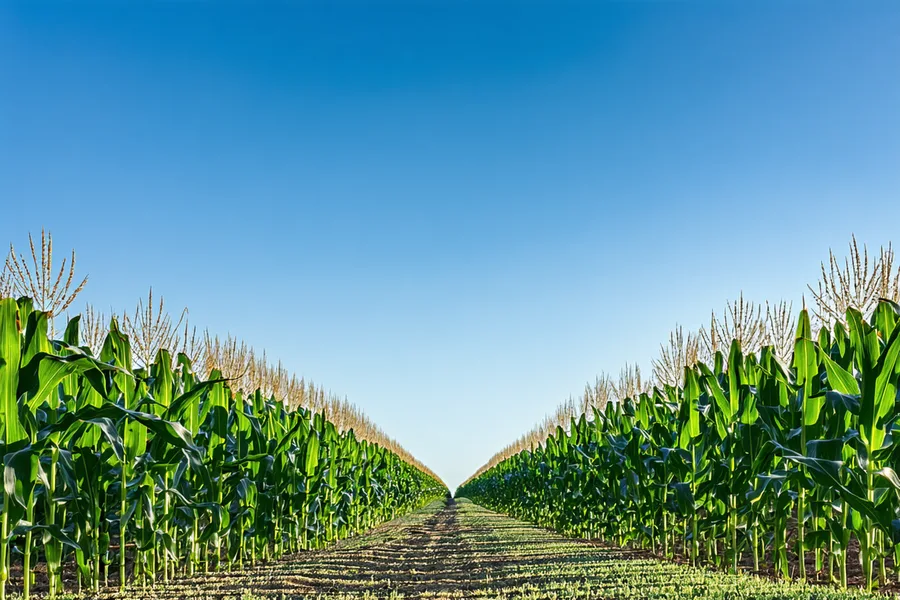
Corn
Corn yield is driven by GDD accumulation from planting through black layer, kernel number per row determined from V5 through silking, and kernel weight set during grain fill (R1–R6). Our model tracks each phase separately and integrates weekly canopy NDVI to estimate biomass accumulation. Heat stress events during the pollination window are flagged separately and applied as a yield drag adjustment.
Calibrated using combine yield monitor data from enrolled fields in California's Sacramento Valley, San Joaquin Valley, and the Iowa/Illinois/Indiana corn belt.
Row crop 02
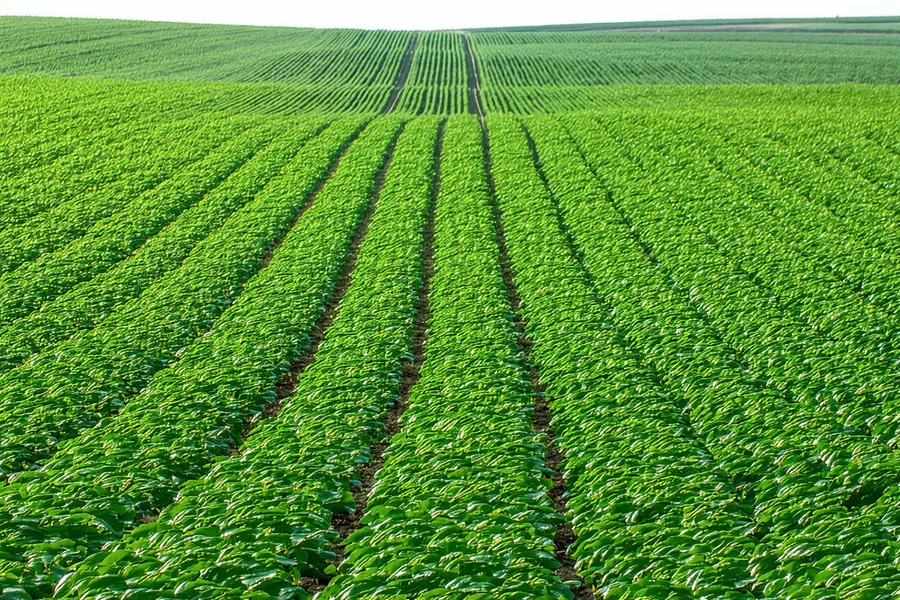
Soybeans
Soybean yield potential is primarily established at pod set (R3), making early R-stage tracking critical. Our model uses canopy closure timing from NDVI progression to estimate R3 date, then applies a pod-count model calibrated to Yolo County and Fresno County field data. Pod fill stress from heat or drought at R4–R6 is applied as a second-stage adjustment.
We validate against combine yield monitor data from enrolled California and Midwest soybean fields after each harvest season.
Row crop 03
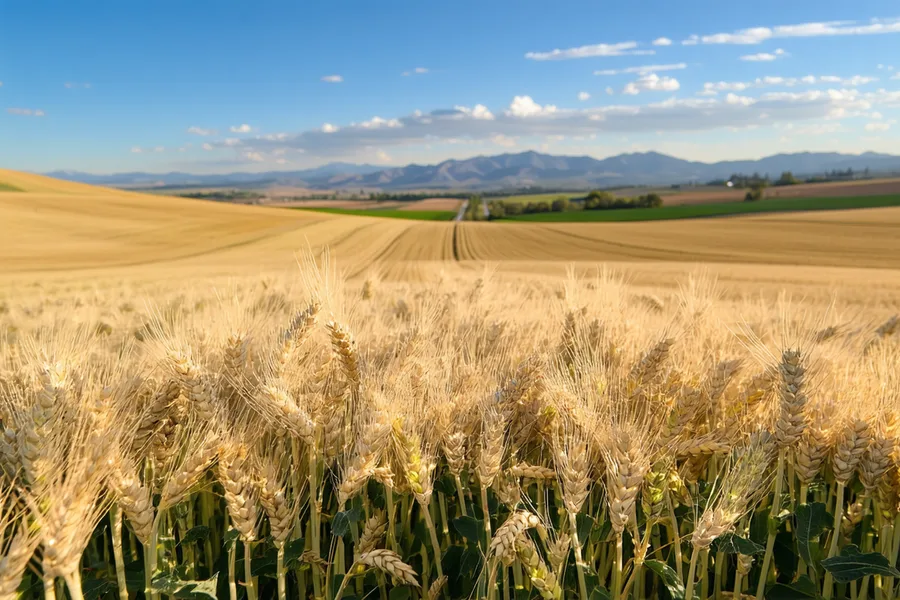
Winter Wheat
Winter wheat yield is strongly influenced by tiller count established before winter dormancy and grain fill rate after flag leaf emergence. Our early-season scoring identifies fields underperforming at tillering — giving a window to intervene with nitrogen or a fungicide application before the critical flag-leaf stage closes the opportunity. After heading date, we track grain-fill degree days through black layer to final yield.
Calibrated to California's Sacramento Valley and Central Valley dryland and irrigated wheat conditions, plus Kansas and Oklahoma winter wheat belt data.
Row crop 04
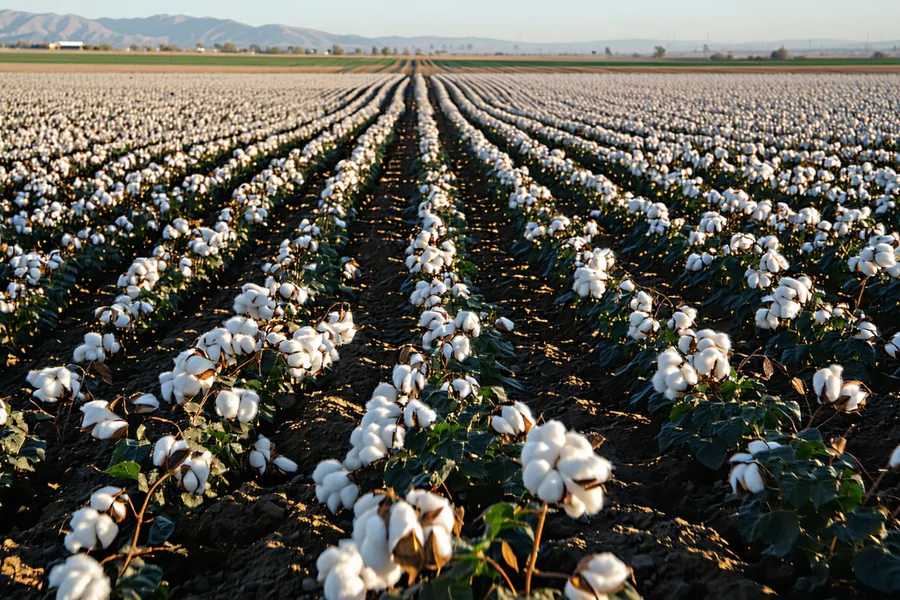
Cotton
Cotton lint yield is determined by boll count set during the first 4–6 weeks of flowering and lint fill through open boll. Our model uses shortwave infrared (SWIR) canopy reflectance to track boll development timing and integrates heat unit accumulation calibrated to the San Joaquin Valley season length. Cut-out date estimation is included, supporting defoliation timing decisions before the harvest window.
Calibrated to San Joaquin Valley cotton production systems (Kings, Fresno, Tulare counties). Drip and furrow irrigation profiles included in the soil moisture component.
Ready to see your fields?
Set up your fields in under 10 minutes. Works with any of the four supported row crops.