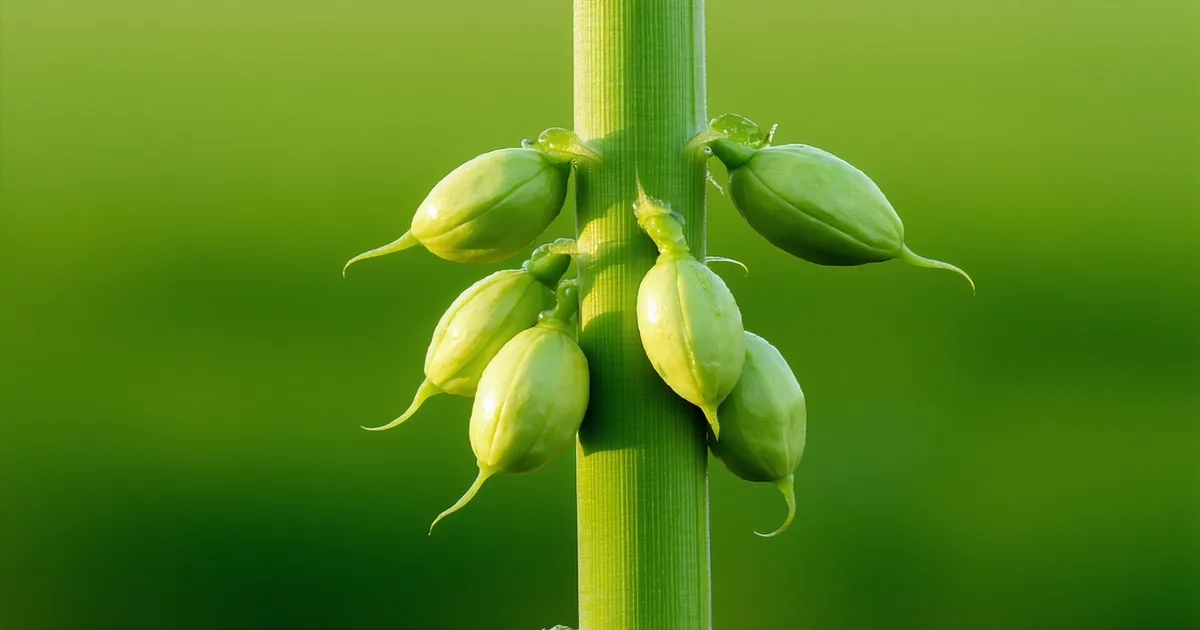
Why Pod Set Is the Right Target
Soybean yield can be decomposed into three components: plants per acre, pods per plant, and seeds per pod, multiplied by seed weight. Of these, pods per plant is the most variable and the most sensitive to environmental stress. A soybean plant can compensate partially for reduced plant population by setting more pods per plant — but it cannot easily compensate for reduced pod set driven by water stress, heat, or a truncated flowering period.
The critical period for pod set in soybeans spans approximately R1 (first flower) through R5 (beginning seed fill). Within that window, R3 (beginning pod) to R5 is the single highest-sensitivity interval: water stress during R3–R5 reduces yield primarily by reducing the number of pods that survive to fill rather than by reducing seed weight. This is well established in the soybean physiology literature and forms the basis for the USDA NASS Objective Yield Survey sampling protocol, which counts pods at the R6–R7 stage to estimate county-level yield.
The model challenge, then, is this: if you want to forecast yield before R6, you need to estimate pod count before it can be directly measured. That requires building a relationship between observable inputs — canopy development timing, accumulated GDD, stress event history — and the pod count that will be realized at harvest.
Building the Pod-Count Proxy
We don't directly count pods from satellite imagery. Current Sentinel-2 resolution of 10m is nowhere near sufficient to resolve individual pods on a plant canopy. What we model is an expected pod count per plant, derived from three proxy inputs that are observable or estimable from available data.
Canopy closure timing. Soybeans at R1 with full canopy closure and LAI above 4.5 have had an uninterrupted vegetative development. Earlier canopy closure, controlling for planting date, correlates with higher plant populations and stronger pre-R1 growth — both associated with higher per-plant pod set potential. We derive canopy closure date from the NDVI time series: the point at which the NDVI curve flattens after its steep vegetative rise, typically between V5 and V7 in indeterminate varieties.
Accumulated GDD from planting through R1. Soybean development is temperature-driven, with base temperature 50°F and a daylight-length trigger for flowering in photoperiod-sensitive varieties. GDD accumulation from planting to R1 gives us an estimate of how long the vegetative period ran. A longer vegetative period under good conditions means more nodes, which means more potential pod sites. In California growing conditions (Yolo County, Fresno County), varieties are typically Group IV or V maturity — longer season than typical Midwest plantings — and the R1 timing relative to accumulated GDD reflects variety-specific heat unit requirements we calibrated from multi-year planting date trials.
Stress event history from planting through R3. We construct a simple stress index based on daily estimated evapotranspiration demand versus available soil water supply (derived from rain gauge data and soil texture). Days when ET demand exceeded estimated soil water availability by more than 15% are scored as "moderate stress events." Days exceeding 30% are scored as "severe." The cumulative stress score from planting through R3 is used to apply a pod set penalty: moderate stress days reduce the expected pod count by a small fraction per day; severe stress days have a larger penalty, calibrated to published drought stress response curves for Group IV varieties.
Validation Across Yolo County and Fresno County Fields
Initial model calibration used field data from 34 soybean fields across Yolo County and Fresno County, spanning three growing seasons (2021–2023). Field boundaries were drawn from grower-provided records. Yield monitor data was used as the validation target for 28 of the 34 fields; for 6 fields without yield monitor capability, APH (Actual Production History) records from crop insurance files were used, corrected for any year-level county APH adjustment factors.
Calibration was done in two stages: first fitting the pod-count proxy model against hand-count data from 12 fields where we had access to R5-stage pod count observations (from grower agronomist scouting records, not our own measurements), then propagating those calibrated relationships through the full 34-field set and comparing predicted yield against combine averages.
Mean absolute error across the 34-field calibration set was 4.8 bu/ac at the R5-stage forecast. That sounds encouraging, but we're cautious about overstating it: the calibration and validation sets overlap (we didn't hold out a separate test set for the Yolo/Fresno fields), and soybean yield variability in California is different from Midwest dryland conditions — irrigation access compresses the lower tail of the stress distribution. The model needs to be validated on broader geographies before we'd generalize the accuracy claim.
We're not saying the 4.8 bu/ac figure represents universal soybean forecasting accuracy. We're saying it represents calibration error on a specific regional dataset under irrigated conditions. Extrapolating that number to rainfed Midwest soybeans without separate validation would be overreach.
Where the Model Struggles
Two systematic error patterns appeared in the Yolo County calibration that we haven't fully resolved.
Late-season canopy lodge and disease. Four fields experienced significant white mold (Sclerotinia sclerotiorum) pressure in 2022 — a year with unusually wet conditions during late vegetative growth. The disease reduced yield through pod abortion and seed quality degradation in ways that didn't register in the NDVI time series until R5, when canopy collapse became visible. By that point the R5 forecast had already been issued. The stress index didn't capture pathogen-driven pod loss because it was built around abiotic stress (water balance) rather than biotic pressure.
Indeterminate variety response under heat stress during R3–R5. Some Group V varieties planted in Fresno County under hot-summer conditions showed an extended flowering period that partially compensated for early pod abortion — the plants continued setting new flowers at higher nodes even as lower pods aborted under heat. Our model applied a fixed pod-set efficiency that didn't capture this compensatory response, leading to slight yield underestimates on those fields.
The Connection to Crop Insurance APH
One practical application of a soybean yield forecast that doesn't get enough attention is crop insurance loss verification. Under RMA policies, the Actual Production History (APH) establishes the yield guarantee, and loss adjustments are made against that guarantee. A grower who experienced a stress event during R3–R5 — late drought, heat event, or severe hail — may have a legitimate yield loss claim, but the loss adjustment process requires establishing what the expected yield would have been absent the stress event.
A field-level yield forecast issued before the stress event, based on canopy development and GDD accumulation up to that point, provides a defensible pre-stress baseline. This is not a replacement for the formal RMA loss adjustment process — the adjuster's field inspection is still required, and the official loss calculation uses APH guarantee against measured production. But having a model-derived pre-event yield estimate can help growers understand whether their documented loss is consistent with what an independent yield model would have projected, and helps them enter the loss adjustment conversation with quantitative field-level data rather than only historical APH records.
In our work with growers in Fresno County, one field experienced a significant water delivery curtailment in early R4 — a canal system issue that reduced irrigation for approximately 18 days during peak seed fill. The pre-curtailment R3 forecast had projected 54–62 bu/ac. Final yield came in at 41 bu/ac. The 13–21 bu/ac gap was consistent with published estimates of R4 drought stress yield loss in Group V soybeans. The grower's insurance claim was filed and adjusted with that context available. We're not suggesting the model output drove the adjustment outcome — that was between the grower and the adjuster — but having a documented pre-stress estimate was valuable context.
What's Next for the Soybean Model
Three development areas are active for the soybean component. First, integrating Sentinel-2 red-edge band data to improve canopy biomass tracking through R3–R5, when NDVI saturates and loses sensitivity to the yield-relevant variation in pod development. Second, adding a simple disease pressure probability module based on cumulative leaf wetness and temperature conditions during vegetative and early reproductive stages — a proxy for white mold and sudden death syndrome risk rather than a direct detection signal. Third, expanding the validation dataset to include rainfed Midwest soybean fields, which will require building relationships with growers in Illinois, Indiana, and Missouri who can share yield monitor data against our model forecasts.
The Yolo and Fresno calibration was a starting point, not a conclusion. Pod-count modeling in soybeans is active research territory — the USDA ARS, university extension programs, and commercial precision ag companies are all working variants of this problem. Our contribution is trying to build something that is calibration-transparent and gives growers a reproducible, field-level estimate they can hold against their own observations.