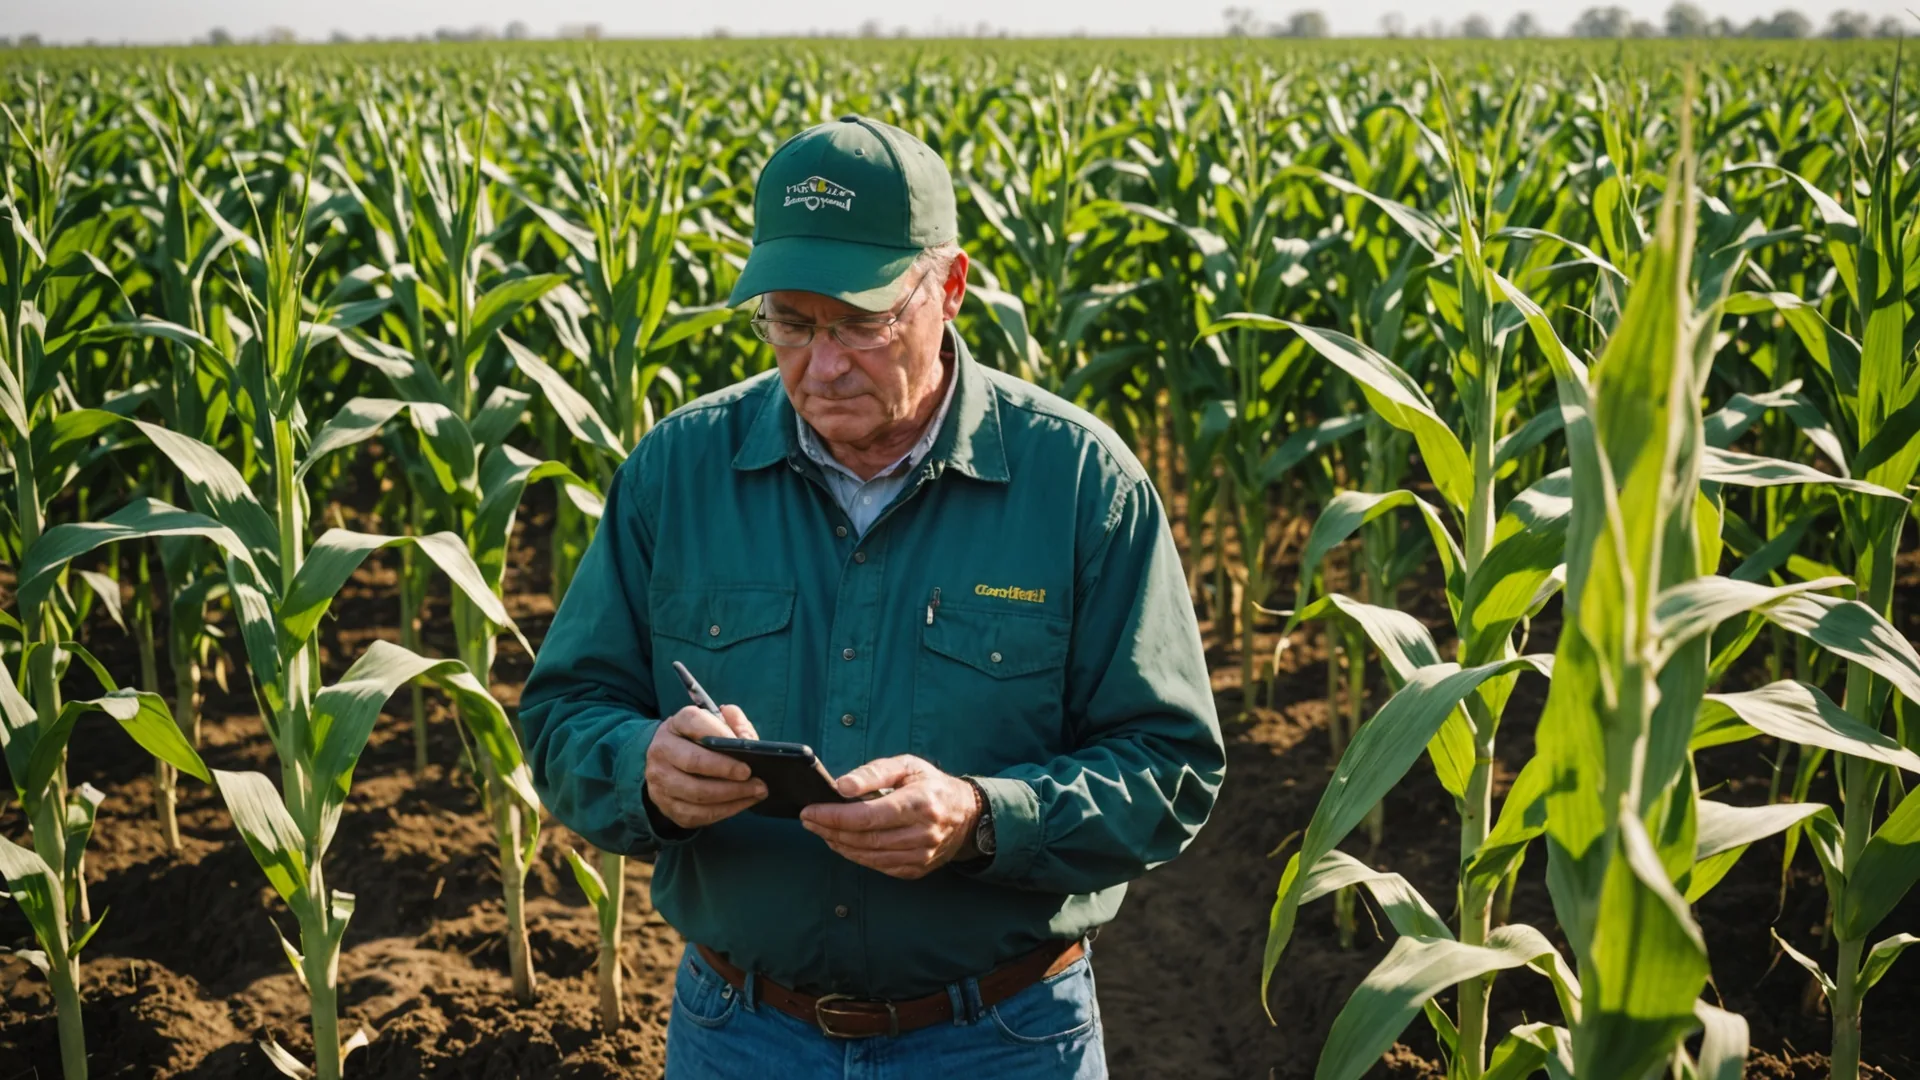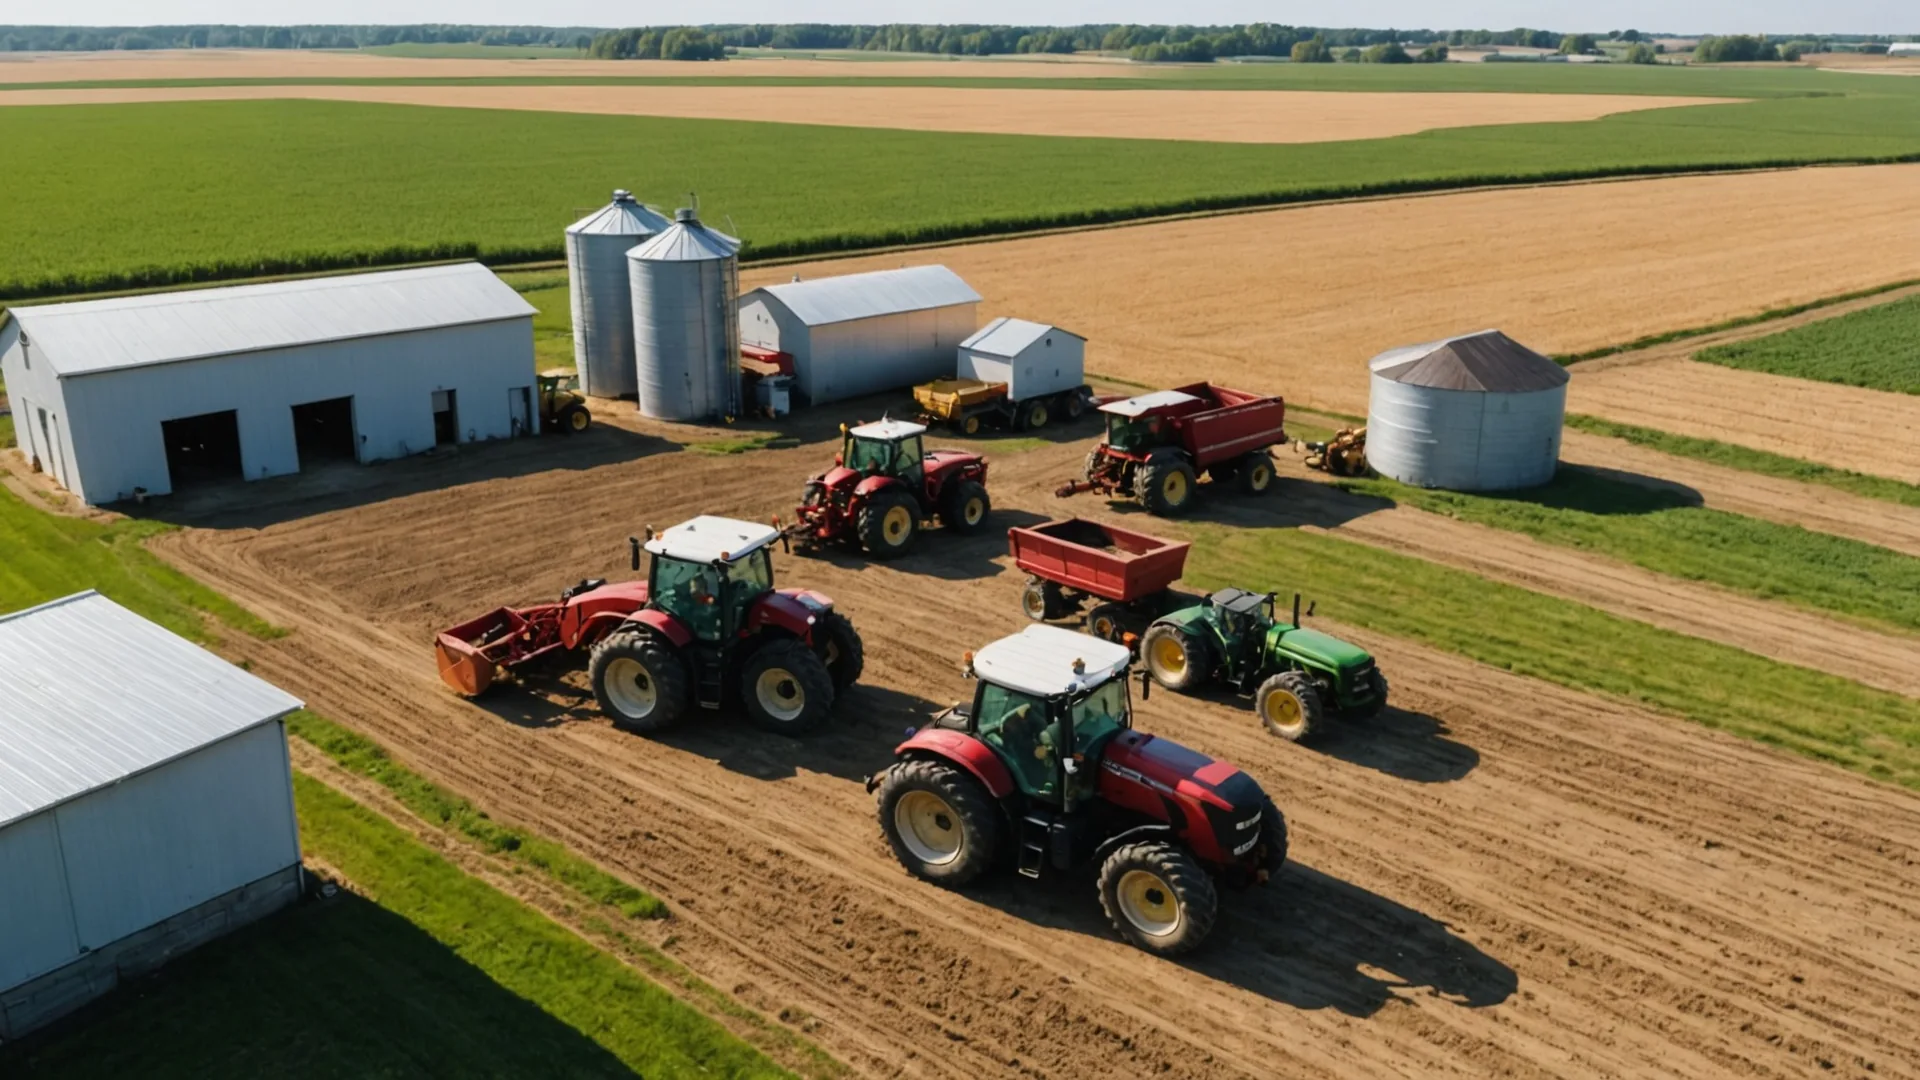

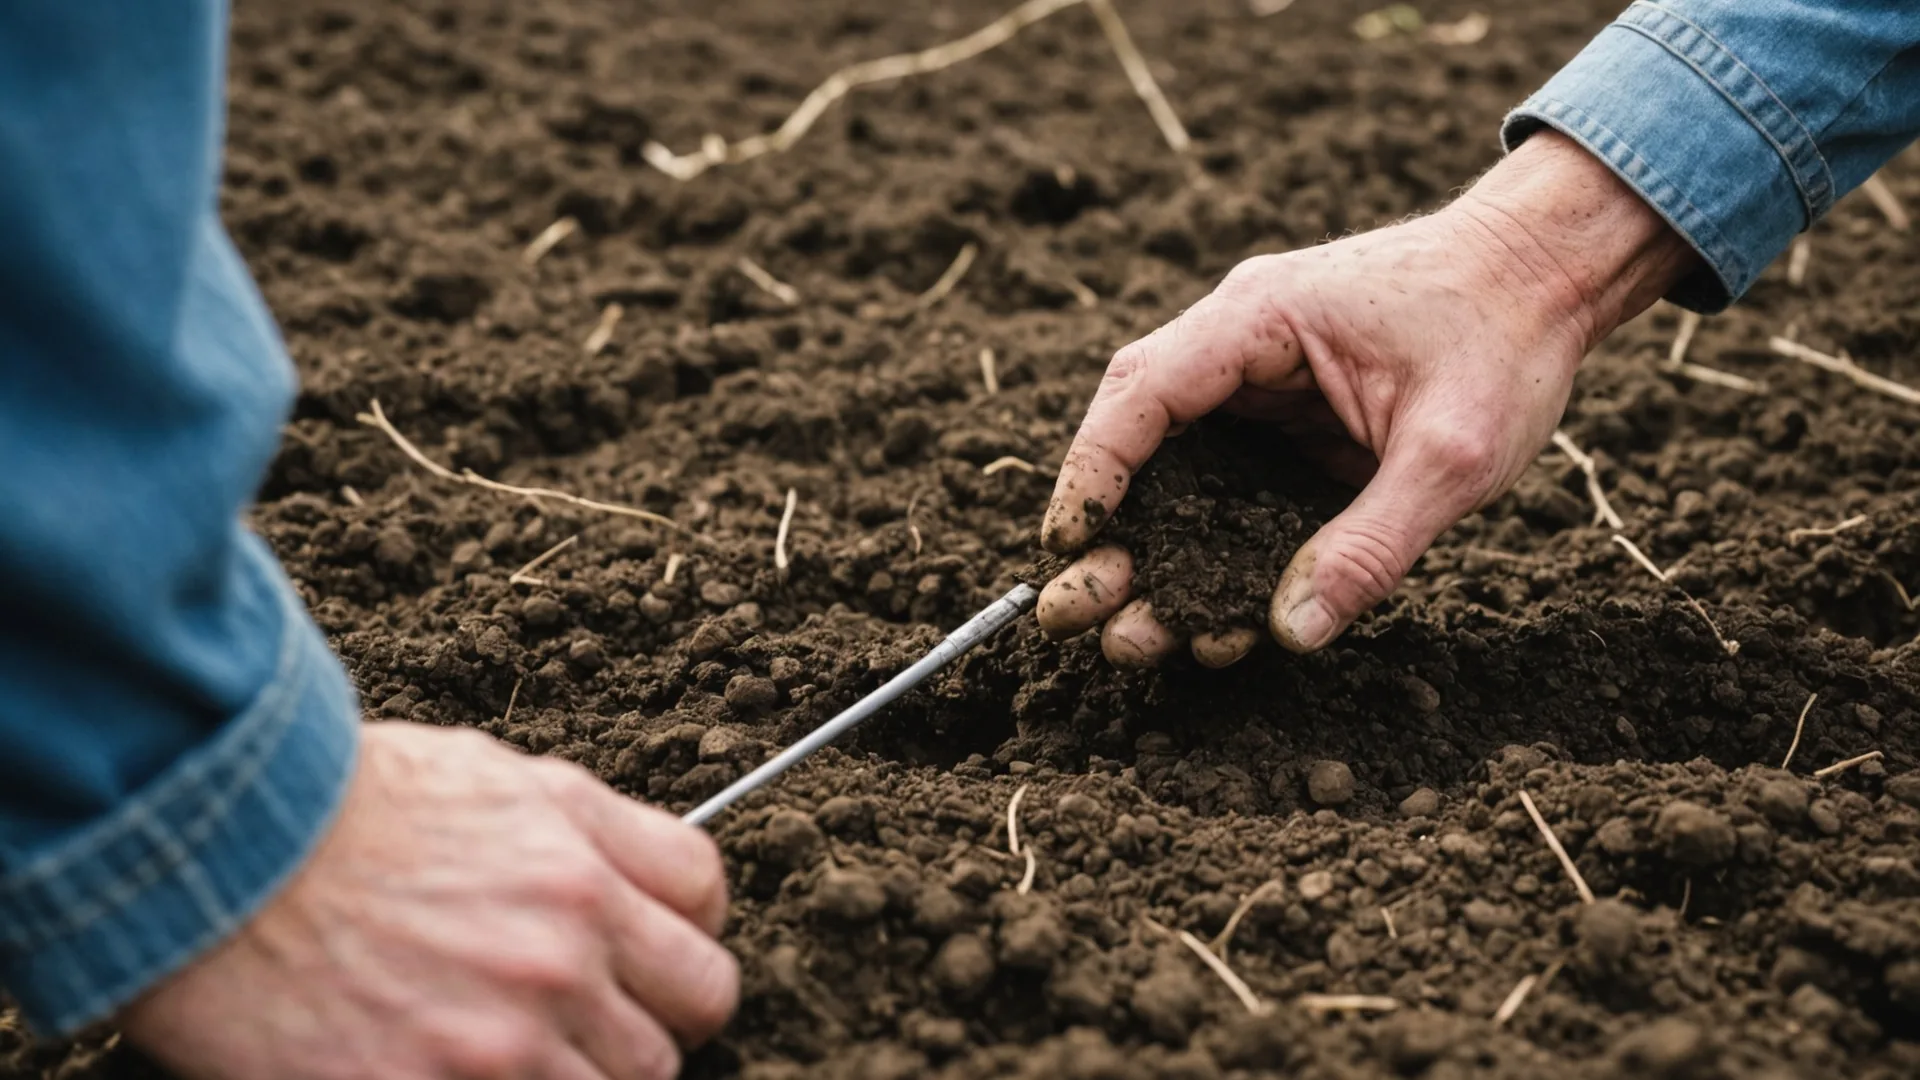
Pull up a five-year composite yield map on any 160-acre field in the Corn Belt and you'll see it: a pattern of high and low zones that repeats year after year, with some variation but surprising consistency. That consistency is the soil talking. It's telling you that the variation you're seeing at harvest isn't random — it's driven by differences in drainage class, organic matter, available water-holding capacity, and nutrient availability that are baked into the landscape. The frustrating part is that most yield-map analysis stops at the map. It doesn't connect back to the soil data that explains the pattern. And the reason it doesn't, most of the time, is that the soil sampling grid wasn't designed to capture the variation the yield map is showing.
The Mismatch Between Sampling Density and Field Variability
The standard soil sampling approach on most Midwest row-crop operations is a 2.5-acre grid — one composite sample per 2.5 acres, tested for pH, phosphorus, potassium, and organic matter on a 3-4 year rotation. That's a reasonable starting point, but it has a fundamental limitation: it treats the sampling grid as the unit of variability, not the actual soil-type transitions in the field.
In a field with two dominant soil series — say, a well-drained Drummer silty clay loam upland and a poorly-drained Harpster clay loam bottom — the management zone boundary runs wherever the topography and drainage patterns dictate. That boundary might cut diagonally across five 2.5-acre sample zones, with every sample straddling both soil types. The resulting data looks like an average of two distinct systems rather than a clear picture of either.
The yield map, meanwhile, is recorded by the combine at 3-5 second intervals, producing a point density of roughly 1 data point every 10-20 feet along the header swath. A 160-acre field generates somewhere in the neighborhood of 30,000-50,000 yield data points per season. The comparison to 64 soil samples (at 2.5-acre grid) is stark. Your yield data has 50,000 pixels. Your soil data has 64.
Why the Disconnect Matters for Nutrient Management
Soil sampling exists primarily to inform fertilizer decisions — how much phosphorus and potassium to apply, whether lime is needed to correct pH, and what the organic matter baseline looks like for nitrogen crediting. If the sampling grid doesn't capture the actual soil variability in the field, those fertilizer decisions are based on averaged data that doesn't represent any particular zone accurately.
Here's a concrete example. Consider a 120-acre field where the eastern third is a highly productive Tama silt loam running 3.4% organic matter and testing at 42 ppm Bray-1 phosphorus — well above the agronomic sufficiency threshold. The western third is a darker, lower Muscatine silt loam that's been pulling corn for 20 years without phosphorus removal credits, sitting at 19 ppm. At a 2.5-acre sample grid, your lab report shows a field average of 30 ppm. You apply a "build" rate based on that average. The eastern third gets phosphorus it doesn't need; the western third gets less than it should. Neither zone is optimized.
At scale on a 1,500-acre operation applying $80/acre in phosphorus and potassium fertilizer annually, misallocation driven by inadequate sampling density can easily represent $15-20/acre in fertilizer efficiency loss. That's $22,500-$30,000 per year — not from bad inputs, but from applying them in the wrong place because the data didn't know where the zones were.
Zone-Based Sampling: Matching Density to Variability
The better approach is to let the field's actual variability structure drive sampling design, not an arbitrary grid. Zone-based sampling uses one or more of these layers to define where the field's boundaries actually are before deciding how many samples to pull:
- Soil electrical conductivity (EC) maps: EC surveys at 2.5 mph with a Veris or Dualem sensor capture apparent soil EC at multiple depths and correlate strongly with soil texture, organic matter, and cation exchange capacity — the properties that drive most of the fertility variability. An EC map drawn before sampling tells you exactly where to place sample points to capture each distinct soil unit.
- Multi-year composite yield maps: Zones that consistently over- or under-produce across weather cycles have persistent soil-driven differences worth characterizing. Using 5-7 years of normalized yield data to identify stable high and low zones, then sampling those zones separately, ensures your lab results describe the systems driving yield outcomes.
- Topographic position: In fields with meaningful slope, water and nutrient movement follows topography. Summits, sideslopes, and toe positions typically have distinct nutrient profiles and pH behavior. If you know where those topographic breaks are, you can put sample points in each zone rather than averaging across them.
Zone-based sampling typically requires 20-40% more samples than a uniform grid on the same acreage. On a 160-acre field, that might mean 30 samples instead of 24. The cost difference — perhaps $40-60 per field — is usually recovered in the first year of more accurate fertilizer allocation.
Connecting Soil Data to Yield Map Interpretation
When soil sampling is designed to align with yield zone boundaries, the analysis becomes far more powerful. We can ask questions like: what is the phosphorus level in my consistently high-yielding zone versus my consistently low-yielding zone? Is the yield difference driven by nutrients — in which case fertilizer can partially close the gap — or is it driven by drainage and water-holding capacity, in which case tile drainage or variety selection matters more?
In our work with yield and soil data on Midwest operations, we've found that roughly 40-50% of persistent low-yield zones have a soil chemistry explanation that responds to changed management — pH below 6.0, phosphorus deficiency below 20 ppm, or organic matter below 2.0% that limits nitrogen credit. The other 50-60% are drainage-limited or compaction-limited zones where the yield ceiling is a physical problem, not a fertility problem. Knowing which category your low zones fall into is worth knowing before you spend money trying to fertilize your way out of a drainage problem.
The Sampling Rotation Question: How Often Is Often Enough?
Most agronomists recommend soil sampling on a 3-4 year rotation for phosphorus and potassium, with pH sampled every 2-3 years in fields with history of acidification. Those intervals are reasonable for average conditions — but they assume your fertility program is roughly in balance with crop removal. If you're in a period of high commodity prices with maximum yield targets, crop removal rates for phosphorus and potassium are meaningfully higher, and your soil test levels may be falling faster than the standard rotation reflects.
A practical rule of thumb: sample more frequently in your highest-yielding, highest-removal zones (200+ bu/ac corn fields), and you can extend the interval in lower-yield, lower-removal zones where fertility levels are stable. A 2-year rotation on your top-yielding ground and a 4-year rotation on lower-yield zones averages to roughly the same cost as a uniform 3-year rotation, but gives you fresher data where the stakes are highest.
Yield maps and soil sample records are both valuable on their own. But they're most powerful when they're aligned — when the sample zones match the yield zones and you can see whether a fertility difference is explaining the performance difference. That alignment starts with the sampling design, before the lab ever sees the first core.
— Nadia Oyelaran, Head of Agronomy, Acreweave
Getting Your Historical Data Into Usable Shape
If you have yield maps going back 5+ years but your soil sample records are on paper lab reports or PDFs from three different labs in different formats, the first step is getting both data layers into a common spatial format. That means:
- Geocoding your soil sample points (if you know where they were pulled, a GPS or Google Earth pin per sample gets you most of the way there)
- Normalizing yield data across years — year-to-year yield differences from weather need to be removed so you're looking at relative zone performance, not absolute yield variation driven by drought years vs. good years
- Overlaying the two layers to identify which soil test values correspond to which yield zones
At Acreweave, we ingest historical yield maps and soil test records as part of the platform onboarding process and build the zone overlay automatically. But even without a platform, a GIS-capable agronomist can do this work manually for a field set that merits the investment. The output — knowing which zones have which soil chemistry and what they produce — is the foundation of every meaningful input decision on the farm.
The yield map tells you where. The soil record tells you why. Getting those two layers aligned is the single most valuable agronomic exercise you can do in the off-season.