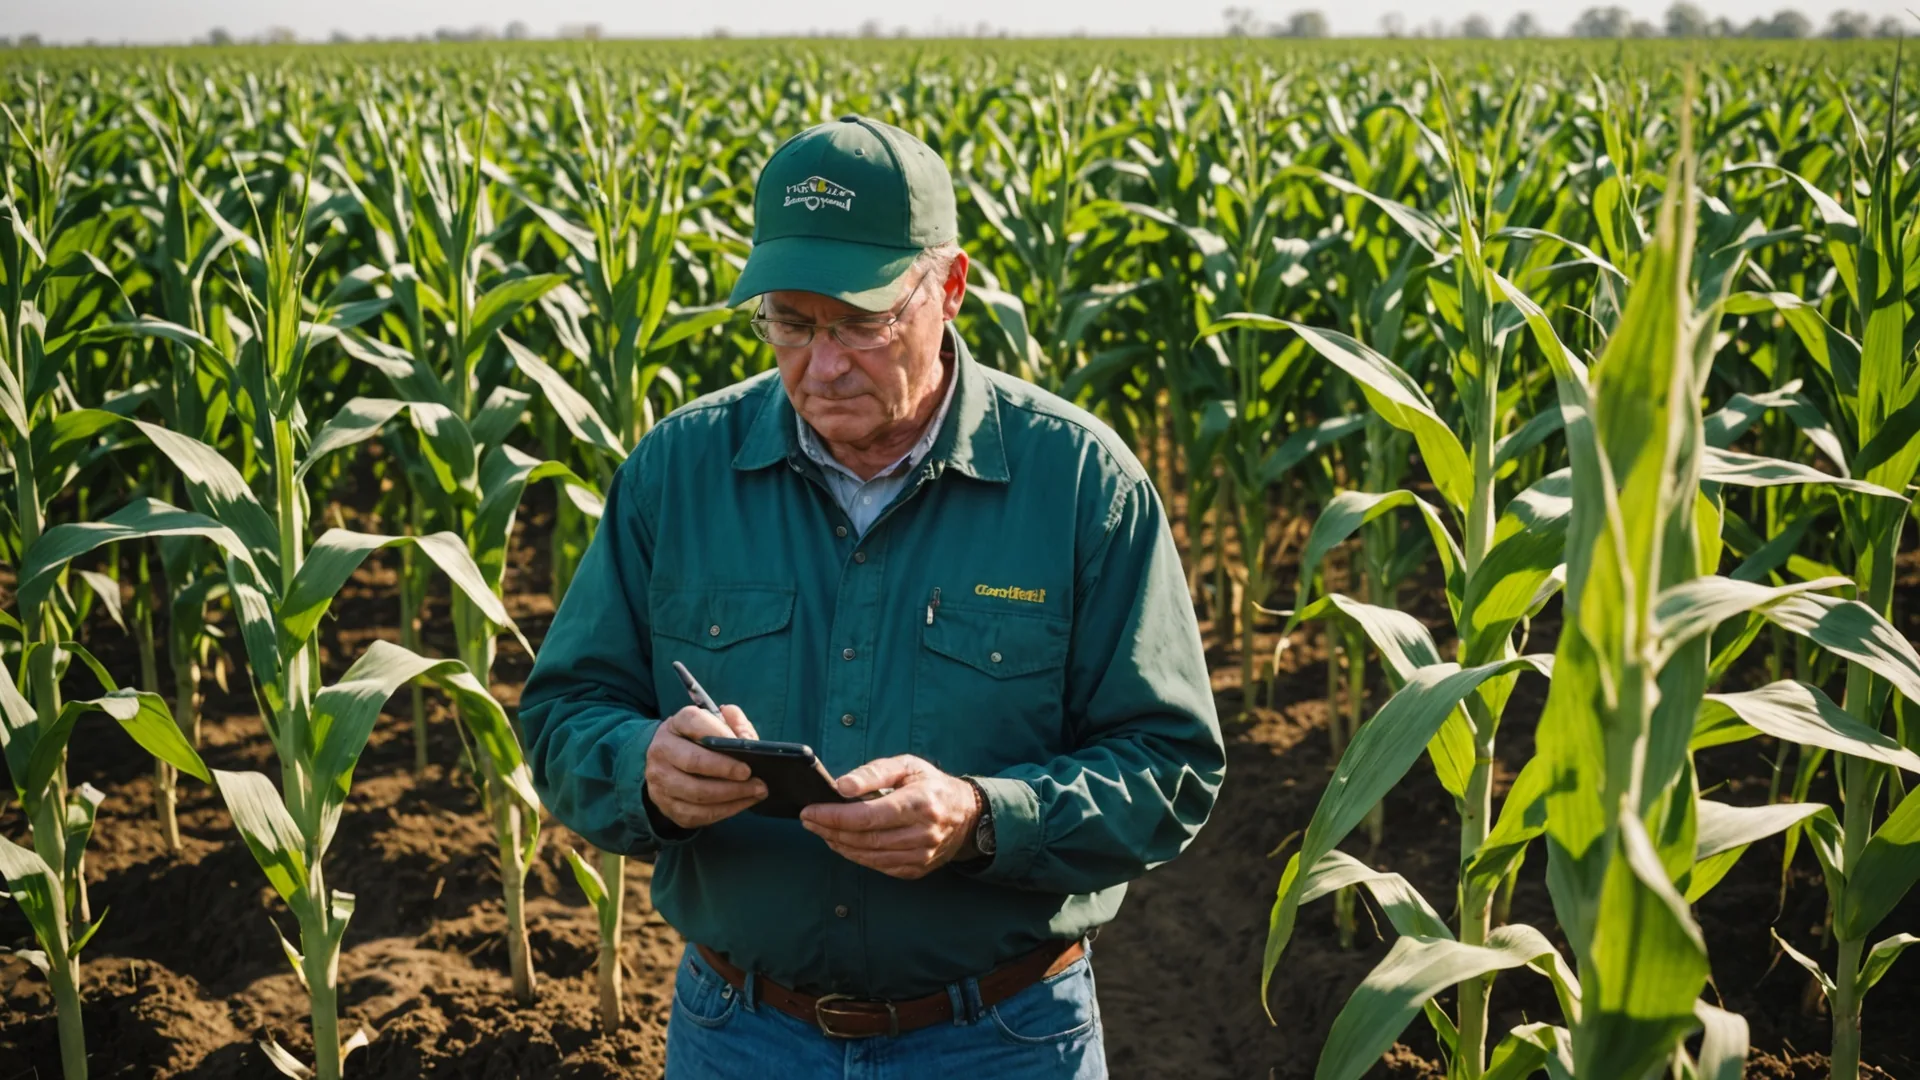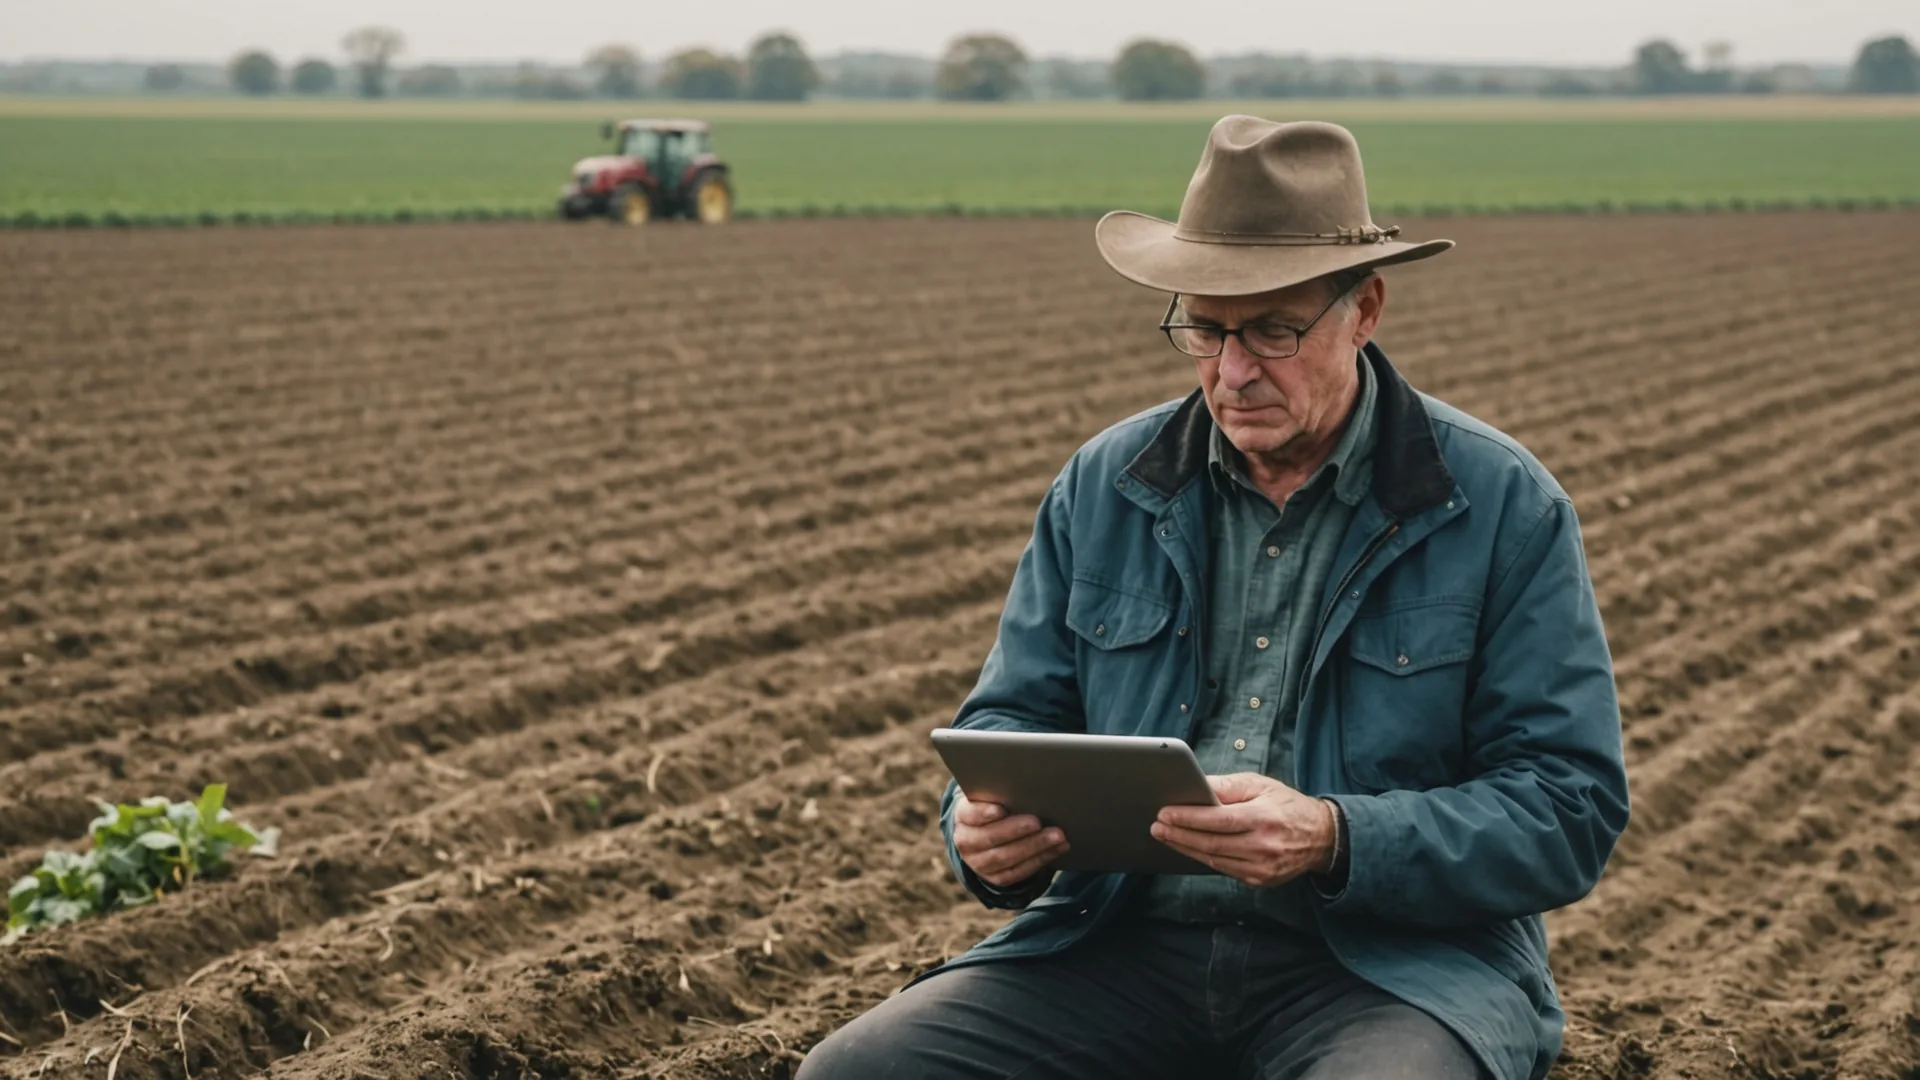
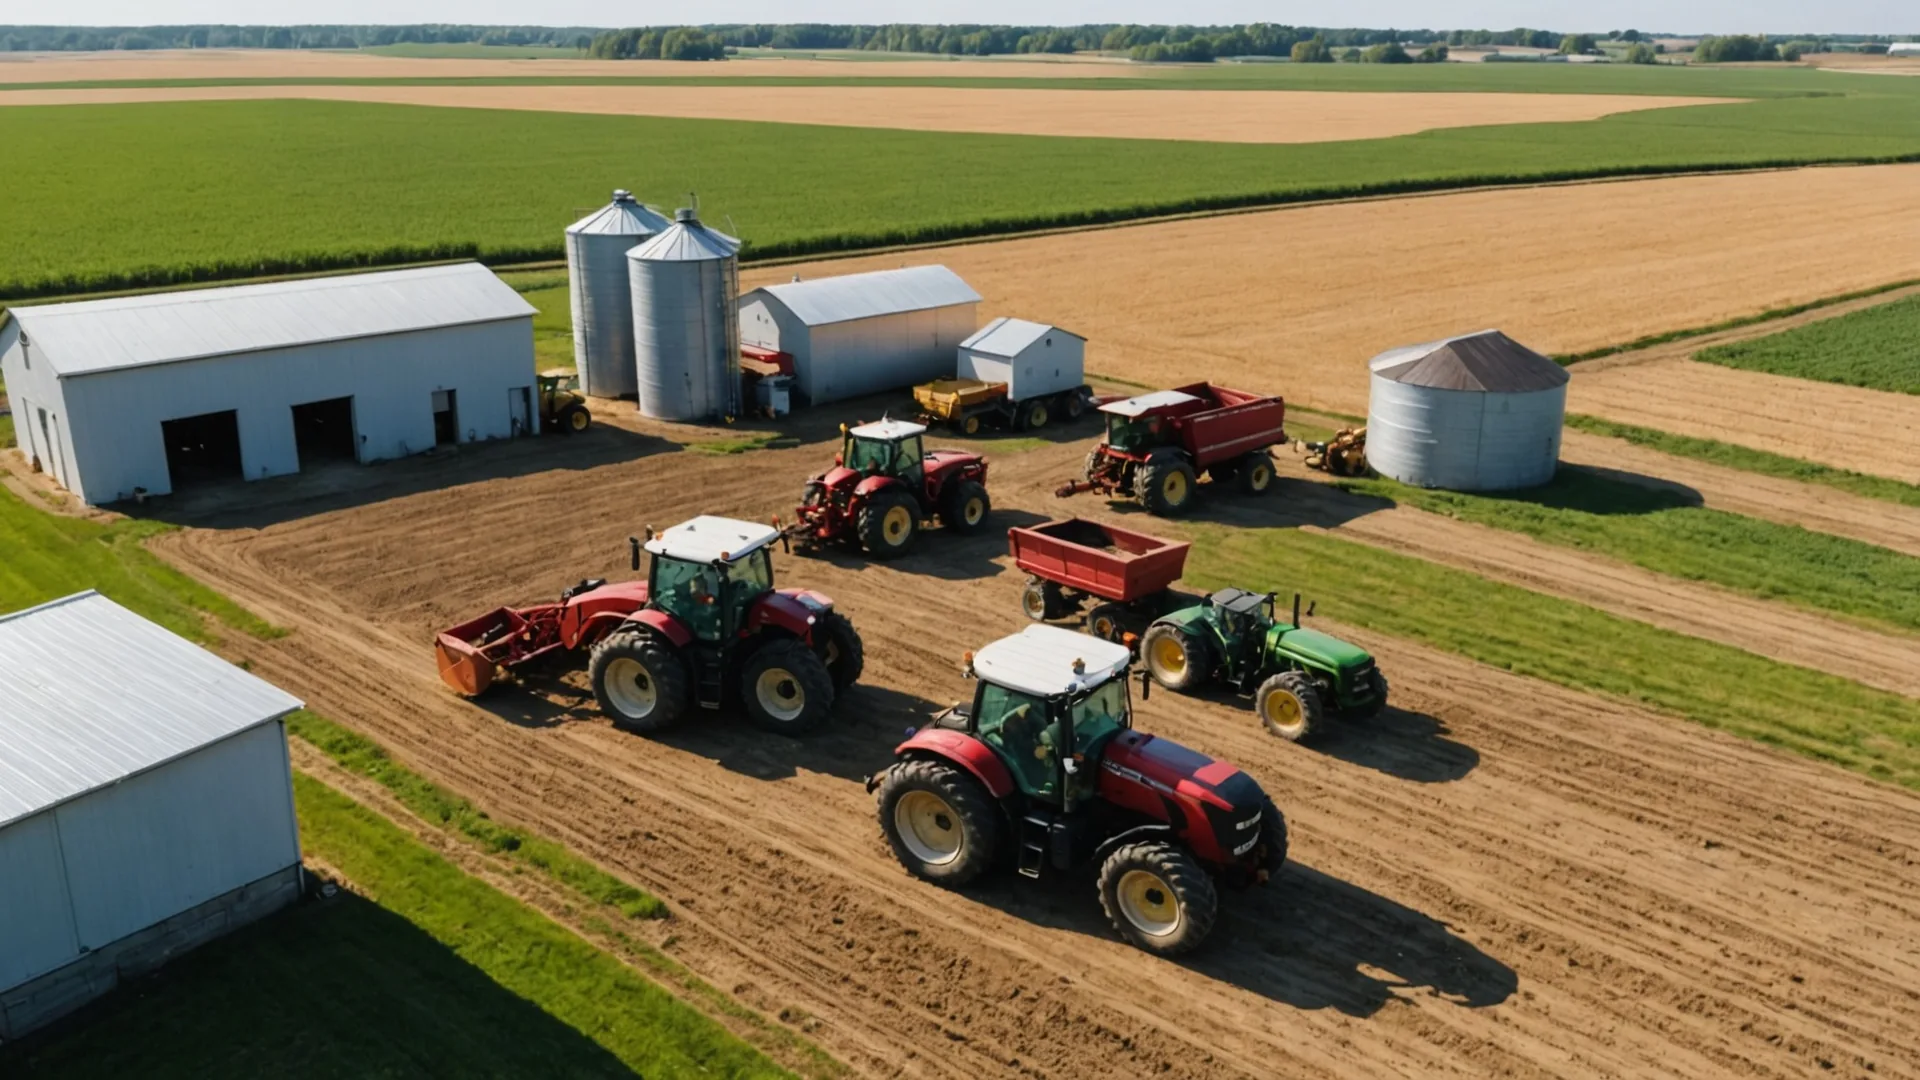
A 2,000-acre corn-soybean operation today generates more field data per season than most farms collected in their entire history a generation ago. Yield maps from the combine. Soil test records from the lab. As-applied maps from the planter and sprayer. Satellite imagery from a subscription service. Weather data from the nearest NOAA station or an in-field sensor. Scout notes logged in a phone app. The data is there. The intelligence gap isn't that the data doesn't exist — it's that none of it talks to the rest of it.
Where the Data Actually Lives on a Typical Operation
Let's map out what a 1,500-acre corn-soybean operation in central Iowa actually has by the end of a full season:
| Data type | Where it lives | Format | Last accessed |
|---|---|---|---|
| Yield maps (5 years) | Climate FieldView cloud or John Deere Operations Center | Proprietary platform map + downloadable shapefiles | End of harvest, then rarely |
| Soil test records | Lab PDF reports (A&L Great Lakes or Midwest Labs) + maybe a spreadsheet | PDFs, sometimes CSV exports by field | When the fertilizer plan is written, every 3-4 years |
| As-applied maps (seed, fertilizer) | Planter monitor data on AFS or Precision Planting platform | Field records, downloadable shapefiles | During the season for equipment troubleshooting |
| Weather data | Phone weather app, DTN terminal, or a personal weather station app | Real-time only, no historical log tied to field records | Daily, but not archived per field |
| Scout notes | AgriSync app, notebook, or email to crop consultant | Text + photos, field-tagged or not | During the scouting season |
| Satellite NDVI | FieldView, Granular, or a standalone service subscription | In-platform visualization, rarely exported | Weekly glance during the growing season |
Each of those data streams has real value. The problem is that they're siloed in six different systems, most of which don't know the others exist. Your soil test results have no relationship to your yield map in the software. Your satellite anomaly alert doesn't know that the flagged zone is also your lowest-phosphorus zone and your latest-planting zone. The person who could connect those dots — you, your agronomist, your crop consultant — is juggling six tabs and a stack of PDFs.
What Decisions Suffer Most from the Silo Problem
Not every farm decision requires integrated data. Pest ID in the field doesn't need soil test history; it needs eyes and a field guide. But several of the highest-value agronomic decisions do require connecting data layers — and these are exactly the decisions where most farms are flying partially blind:
Nitrogen application timing and rate. The right sidedress rate depends on what the soil will supply from organic matter mineralization (soil records), what the crop has already accumulated (growth stage from planting date records + GDD data), and what the precipitation forecast suggests about leaching risk (weather). That's four data streams. Most growers are working with one or two of them in a rough mental model.
Zone-specific variable-rate prescriptions. A VRA (variable-rate application) prescription for phosphorus or lime requires knowing both what the soil test says and what the yield map shows about how that zone responds to fertility. If your soil test zones don't match your yield zones — a common problem when sampling grids don't align with field variability — your VRA prescription is averaging data that should be stratified.
In-season scouting prioritization. When you have 1,500 acres and 40+ fields, you can't personally scout everything every week. The fields that need scouting most urgently are the ones where satellite anomalies, crop growth stage, and stress-risk factors converge. Without integration, you're either scouting by habit ("I always do the south fields first") or waiting for a problem to be obvious enough to see from the road.
Why This Problem Has Persisted
The ag-tech industry has been talking about "connected farm" solutions for at least a decade. So why are most operations still running five separate platforms?
Interoperability between the major platforms has improved, but it's still imperfect. Climate FieldView can import yield data from John Deere Operations Center, but the soil test records from your lab report still need to be manually entered or formatted for upload. As-applied maps from one brand of planter monitor don't automatically flow into the yield analysis platform from a different ecosystem. Satellite imagery services often have visualization tools but don't expose the underlying data for analysis with other layers.
The bigger issue is that even when data can theoretically be connected, the analysis work still falls to the farmer or agronomist. Raw connected data doesn't make decisions. It makes spreadsheets. What's missing is the layer between the data warehouse and the action — the model that looks at all six data streams simultaneously and surfaces the three things that matter this week for each field zone.
What Integration Actually Needs to Look Like
We built Acreweave to work with the data infrastructure that row-crop operations already have, not to require a complete replacement of it. The integration philosophy is: read from the tools you already use, combine what matters, and surface it as a field-zone action, not a data report.
In practice that means:
- Pulling yield history from Climate FieldView or John Deere Operations Center via their APIs — no manual export, no shapefile formatting
- Ingesting soil test records from a CSV or direct lab report upload, then spatially joining them to the yield zones we've built from yield history
- Pulling Sentinel-2 satellite NDVI on a 5-day cadence and computing deviation from each zone's historical same-week baseline
- Linking to the nearest NOAA station feed for real-time precipitation and temperature accumulation — tied to each field's specific location, not a regional average
The output of that integration isn't a visualization dashboard where you can explore the data. It's a weekly action queue: which fields need attention, what the data says is going on, and what the recommended response is — with a confidence level attached to each recommendation so you know how much weight to put on it.
The Organizational Challenge Is Bigger Than the Technical One
In our conversations with farm operators during the Acreweave early access period, we've heard a consistent theme: the data integration challenge is as much organizational as technical. Records are scattered across multiple people (the farmer, the crop consultant, the hired operator who ran the planter last spring), and there's no clear owner for making sure the data gets collected, organized, and connected season to season.
The technical connection between platforms is solvable — APIs exist, data standards are improving. What's harder to solve without intentional effort is:
- Ensuring soil test records from 2019 are attached to the right fields in a system that also has 2025 yield maps
- Keeping as-applied maps for variable-rate seeding stored in a format that a yield analysis tool can use three seasons later
- Building a shared field-record culture where the farmer, hired help, and crop consultant are all working from the same ground truth
I've seen operations that have every piece of data they need to make great agronomic decisions sitting in three different platforms with no one connecting them. The data wasn't the problem — the workflow was. Fixing that workflow is worth more than any new sensor or subscription you could add to the farm.
— Tobias Frei, CTO & Co-Founder, Acreweave
Where to Start
If you're looking at your own operation and recognizing the silo problem, here are the highest-value first steps — regardless of whether you use Acreweave or any other integration platform:
- Pick one authoritative home for yield maps. Export all historical yield data from whatever systems it currently lives in and get it into one platform or folder structure that you maintain. Five years of consistent yield history in one place is worth more than ten years scattered across three platforms.
- Attach GPS coordinates to your soil test records. Even if the samples were pulled on a 2.5-acre grid years ago, knowing where each sample came from is the difference between useful spatial data and a table of numbers that can't be mapped.
- Start logging planting dates by field, not by calendar week. When planting date records are specific to each field and zone, they become the anchor for GDD accumulation calculations and growth stage tracking throughout the season.
- Assign data ownership. Decide who is responsible for making sure records are captured and filed at the end of each field operation. On a family operation, this is usually one person's job by default. On a larger hired-help operation, it's worth making it explicit.
The intelligence gap on most Midwest row-crop farms isn't a shortage of data. It's a shortage of connection. The data is already there — it just hasn't been introduced to itself yet.