
NDVI shows up in a lot of ag-tech conversations as though it's a yield number — pull the satellite image, look at the greenness, know what you'll harvest. In our experience working with field-season data across the Midwest, that framing causes real problems. NDVI is genuinely valuable, but what it measures and what drives yield are not the same thing. Confusing them leads to either over-relying on a signal that can fool you, or dismissing it entirely after one season when it doesn't correlate with combine data the way you expected. Neither response serves you well.
What NDVI Actually Measures
The Normalized Difference Vegetation Index is a ratio of near-infrared and red light reflectance. Green, healthy plant tissue absorbs red light strongly for photosynthesis and reflects near-infrared strongly — so high NDVI (roughly 0.6-0.9 for a dense corn canopy) means a lot of healthy, active leaf area is present. Low NDVI means less canopy cover, stress-affected tissue, or both.
What that tells you: how much photosynthetically active canopy is in place at the moment the satellite passed overhead. It does not tell you the water status in the root zone. It doesn't tell you if root development was compromised by compaction in the subsoil. It can't see nodule activity on soybean roots or nitrogen fixation rates. At V6 corn on a hot July afternoon, NDVI might look fine while a drought-stress event is already accumulating in the soil layers below the surface roots.
Sentinel-2 satellite imagery (which we use at Acreweave) captures that 10-meter resolution snapshot every five days under clear skies — roughly 18-22 passes over a Midwest field per growing season, cloud cover permitting. That's a solid cadence for trend detection. But each individual reading is a surface signal. It's a proxy for crop health, not a direct measure of the biological processes that produce grain.
Where NDVI Is Genuinely Useful
With that caveat in place, NDVI earns its role as a monitoring tool in three specific applications where its surface-level nature is actually an advantage:
Early stress detection before visible symptoms. Canopy greenness typically declines 2-3 weeks before visible yellowing or wilting appears in corn. A field that looks fine from the road may already be trending downward in NDVI. A 10-meter resolution pass that shows 0.08-0.12 NDVI units below the historical same-date baseline is your early warning to send a scout — not a yield forecast, but a flag that something warrants ground investigation.
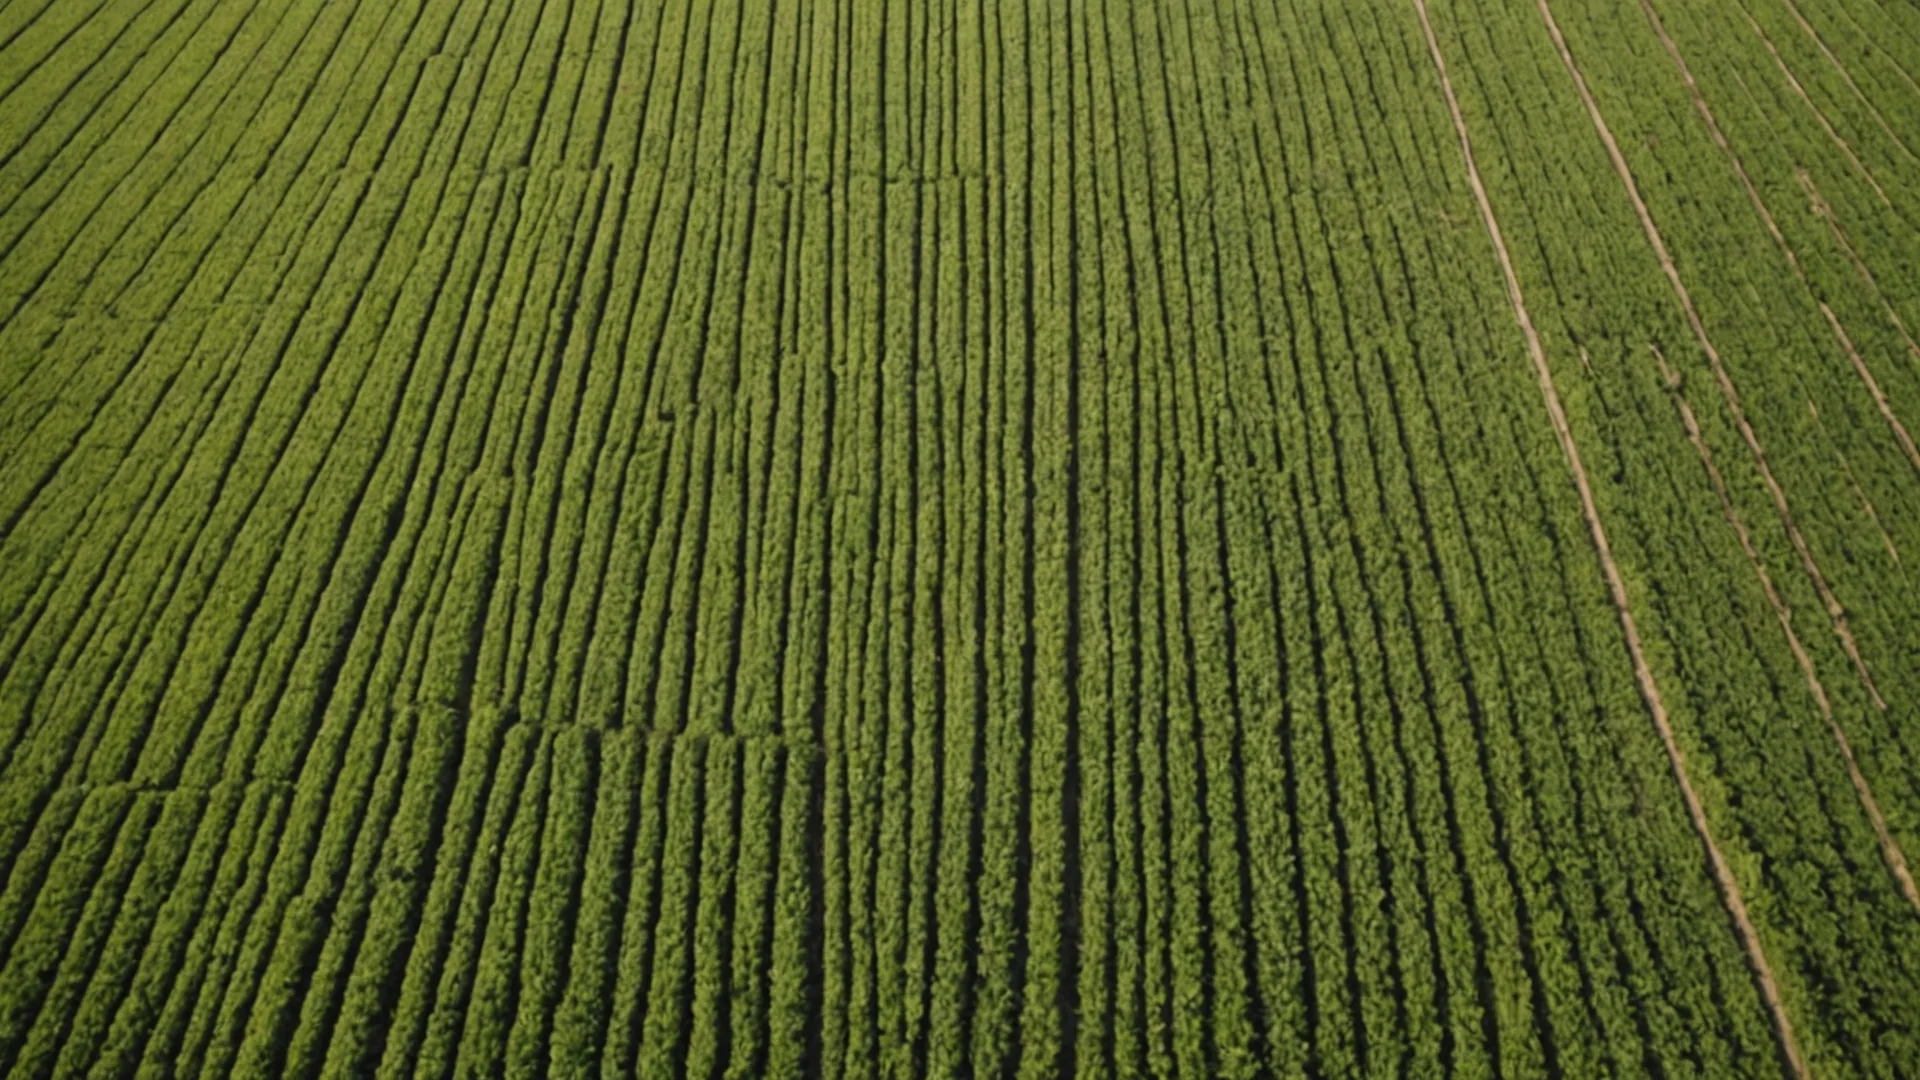
Spatial variability mapping within fields. Yield maps show you where variation happened after the fact. NDVI in early July shows you where variation is developing while you still have time to respond. A zone that's running consistently below the field average by V8-V10 is likely either drought-stressed, nutrient-deficient, or compaction-limited — and each of those has a different response action. NDVI gets you to the right part of the field; your agronomist determines the cause.
Year-over-year trend analysis. A single year's NDVI pattern is informative but noisy — one wet spring can make a mediocre field look great in June. Three to five years of same-date NDVI comparisons across your management zones starts to reveal which zones consistently underperform their neighbors, which fields respond well to good rainfall distribution, and which are consistently drag-prone regardless of inputs. That's planning-quality information.
The Correlation Problem: Why NDVI Doesn't Predict Yield Directly
In university trials comparing in-season NDVI measurements to final yield, the correlation coefficients at single observation points typically run 0.35-0.55. That's statistically meaningful but agronomically weak — you'd be leaving half or more of the yield variation unexplained. The main culprits:
| Yield driver | Visible in NDVI? | Why or why not |
|---|---|---|
| Nitrogen deficiency (mid-season) | Yes — delayed | Chlorosis eventually shows up in canopy reflectance, but 2-3 week lag from biochemical onset |
| Drought stress at pollination | Partial | Canopy stays green while kernel set fails — NDVI looks fine, yield is collapsing |
| Planting population errors | Only early-season | Stand gaps visible at V3-V5 close in as canopy fills; satellite resolution misses small-scale skips |
| Subsoil compaction root restriction | Late and indirect | Roots hitting hardpan show up as mid-season NDVI lag under dry conditions |
| Disease pressure (northern corn leaf blight) | Yes — at scale | Lesion coverage at 10-15% canopy level starts showing in 10m resolution NDVI |
The drought-stress-at-pollination case is the one that catches growers most off-guard. Corn silk elongation and kernel set happen in a 7-10 day window around VT-R1. If the field is running short on soil moisture during that window, yield is being lost at the cellular level while the canopy still looks dark green from above. The satellite image taken on August 1 may show healthy NDVI across every zone of that field. The combine in October will tell a different story.
Making NDVI Actionable: The Context It Needs
Satellite NDVI earns its predictive value when it's layered with the other data streams that explain what the canopy signal can't show directly. In our yield-forecast model, NDVI is one of several inputs — not the primary one. The layers that add predictive power on top of canopy reflectance:
- Soil moisture index from gridded models: tells you whether a good-looking canopy is running on adequate root-zone water or drawing down reserves that will limit grain fill
- GDD accumulation vs. planting date: NDVI values mean different things at V6 vs. R1 — growth stage context is mandatory for interpretation
- Historical yield-map zones: an NDVI deviation that looks alarming in a zone that always underperforms has different implications than the same deviation in your best-performing ground
- Soil EC and OM data: fields with high organic matter sustain green canopy further into drought conditions than sandier ground, even when subsoil moisture is equally depleted
When we compute NDVI anomaly flags at Acreweave, we're calculating deviation from a field-zone-specific historical baseline for the same calendar week — not a single crop-wide threshold. A zone that drops 0.10 NDVI units below its own five-year average is a signal worth investigating. The same absolute NDVI value in a zone that's always low-performing may be entirely normal.
What to Do When You See an NDVI Anomaly
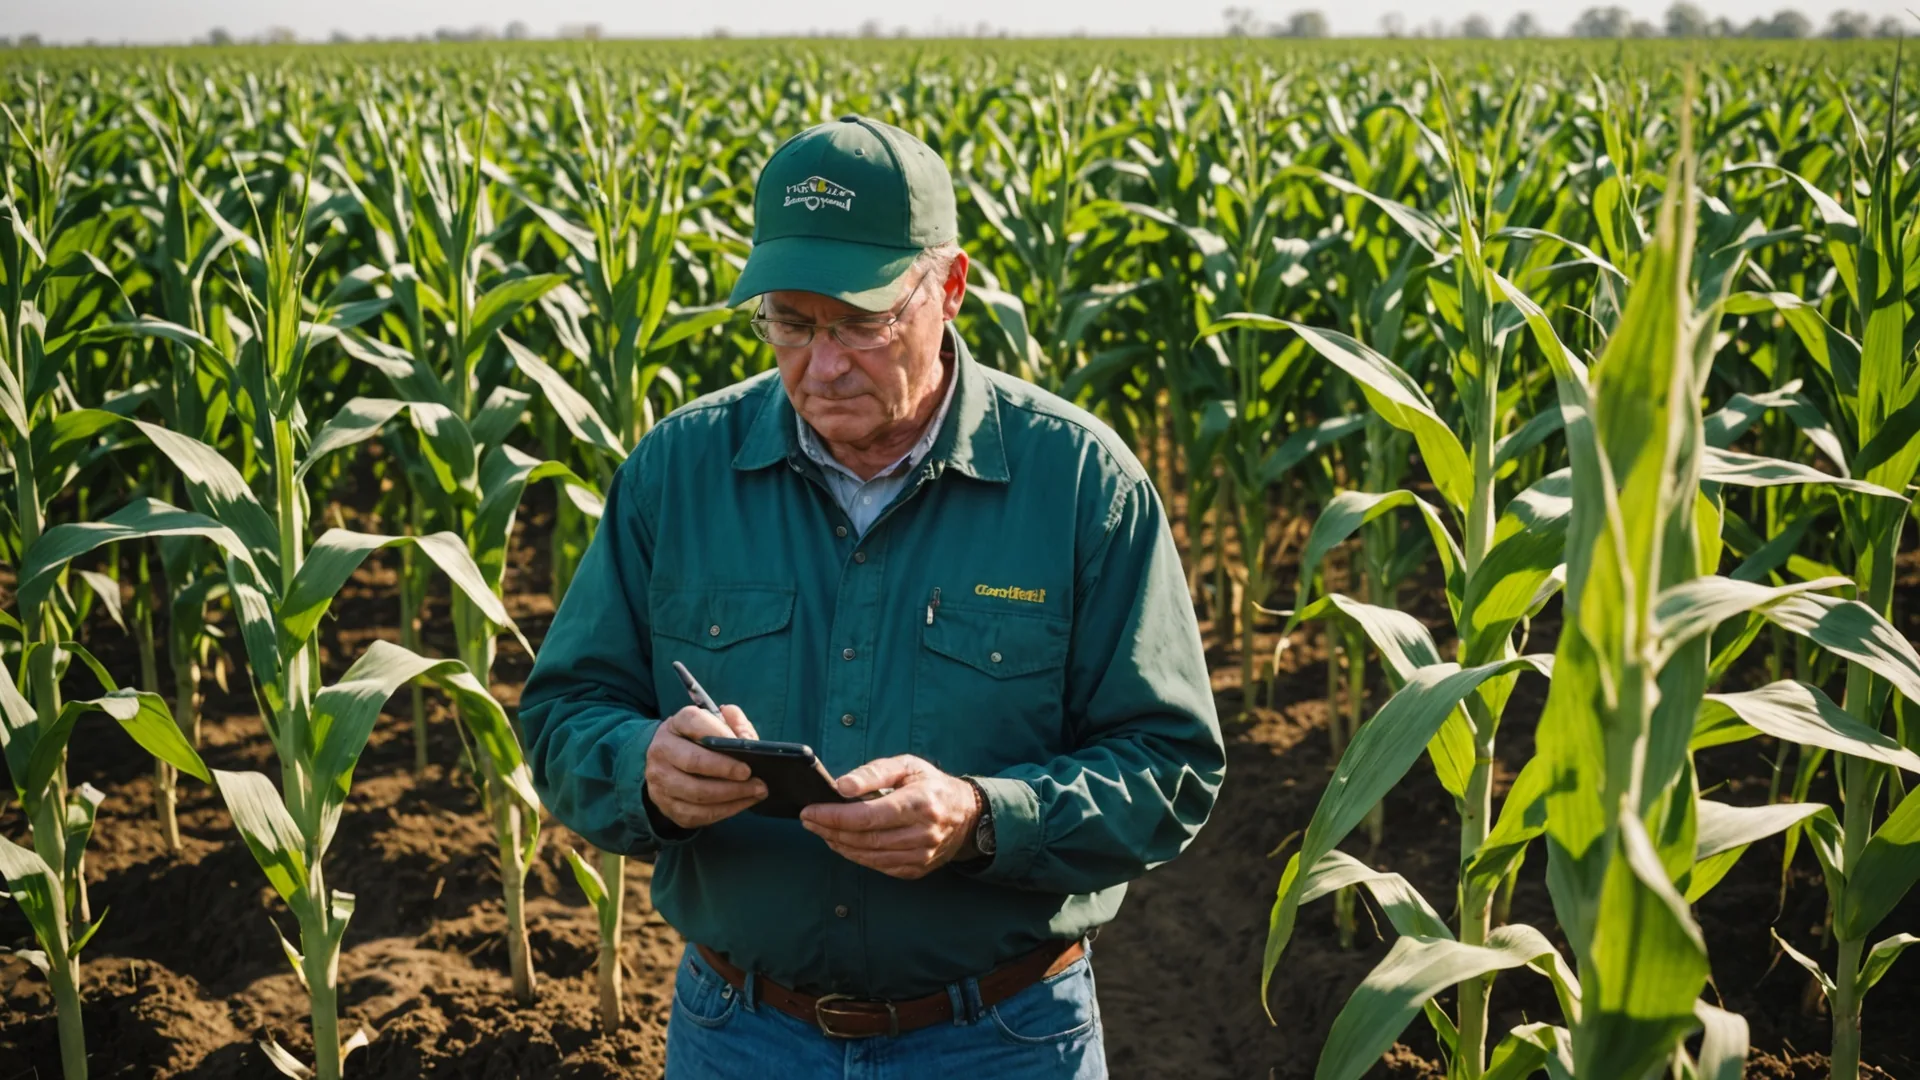
When a flag surfaces, the data has done its job — the next step is boots on the ground. Here's how we'd frame the diagnostic process:
- Identify the zone boundary on the field map and drive to the flagged area.
- Look for visible stress symptoms: interveinal chlorosis (nitrogen), purpling (phosphorus, cold stress), bronzing of upper leaves (spider mites, potassium), wilting pattern (drought, root restriction).
- Pull a soil probe in the anomaly zone and a reference zone. Check for moisture profile differences, hardpan at 12-18 inches, and any obvious root pruning.
- If symptoms aren't explained by what you see above ground, submit a petiole sample to your lab — canopy color alone can't distinguish nitrogen deficiency from sulfur deficiency or Goss's wilt early in its progression.
NDVI gets you to the right 3-acre patch of a 160-acre field. It can't tell you why the crop is stressed once you get there. That part still requires an experienced agronomist's eyes. The satellite's job is to make sure you're looking in the right place before the problem spreads.
The Bottom Line on NDVI and Yield Forecasting
NDVI is one signal in a multi-layer model — not a standalone forecast. In the Acreweave yield-probability system, we treat NDVI anomaly detection as the early-warning layer and run it alongside soil moisture, weather accumulation, and historical zone performance to produce a forecast that actually explains most of the yield variation in a field.
The growers who get the most out of satellite imagery are the ones who treat each anomaly flag as a scouting assignment, not a verdict. They're checking the field, confirming the cause, and acting early enough that there's still something they can do about it. That feedback loop — satellite flag to field diagnosis to corrective action — is where the real yield protection happens.