What the Index Actually Computes
NDVI — the Normalized Difference Vegetation Index — is a ratio of near-infrared (NIR) and red reflectance values captured by a multispectral satellite sensor. The formula is (NIR − Red) / (NIR + Red), and the result runs from −1 to +1. Green, photosynthetically active vegetation reflects strongly in NIR and absorbs heavily in red, producing values typically between 0.3 and 0.9 for healthy crop canopies. Bare soil sits around 0.1–0.2. Open water goes negative.
Sentinel-2, the ESA constellation that feeds most commercial agricultural satellite products, captures Band 4 (red, 665 nm center wavelength) and Band 8 (NIR, 842 nm center wavelength) at 10m spatial resolution, with a 5-day revisit at mid-latitudes when both satellites are combined. That 10m/5-day combination is the practical resolution most row-crop platforms are working with when they say "satellite-derived NDVI."
What NDVI actually measures, at the physics level, is the chlorophyll-driven absorptance of photosynthetically active radiation in the red band, combined with the structural scattering of NIR by leaf mesophyll tissue. When a corn canopy is dense, green, and fully intercepting sunlight, the NIR signal is high and the red signal is low — NDVI goes high. When the canopy thins out from drought stress, disease, or senescence, NIR drops and red rises — NDVI drops.
Where NDVI Is Genuinely Useful for Row Crops
NDVI earns its use in three specific contexts in row-crop monitoring, and they're worth stating precisely rather than gesturing at "crop health."
Canopy closure timing. For corn, canopy closure — defined as the point when the canopy intercepts roughly 95% of incoming PAR — typically occurs between V8 and V10, depending on row spacing and plant population. A rising NDVI time series through June that plateaus around 0.75–0.85 is consistent with full canopy closure. A field that plateaus at 0.60 suggests stand variability, poor early-season growth, or wider-than-standard row spacing. This timing matters because delayed canopy closure is associated with higher weed competition pressure and reduced early-season biomass accumulation — both of which affect final yield.
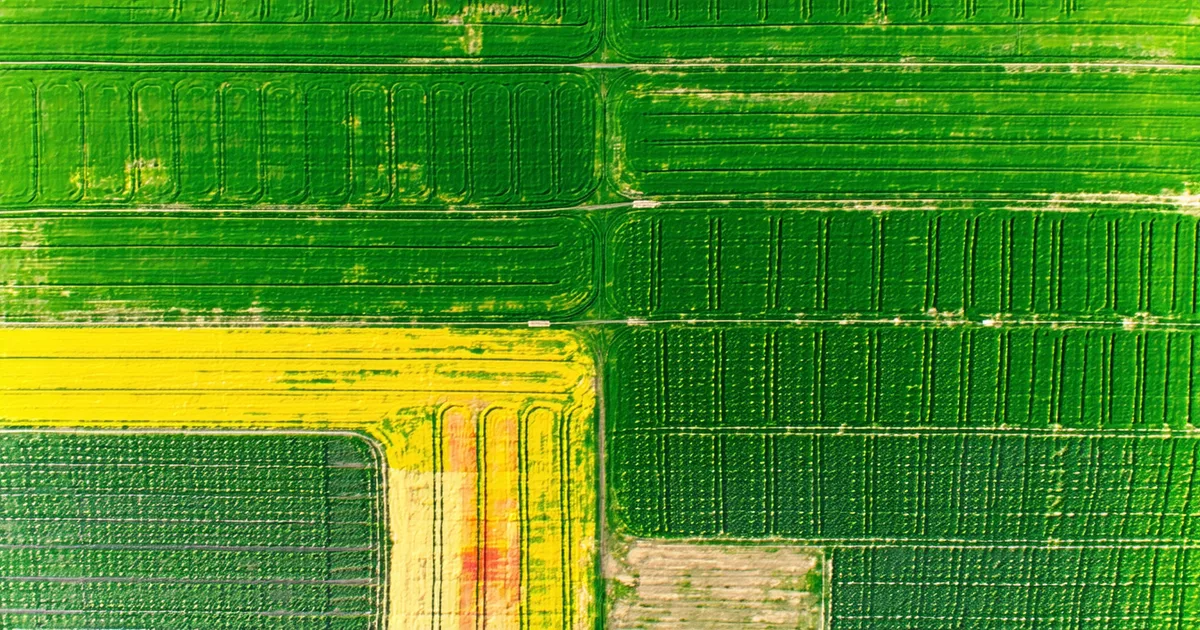
Within-field variability mapping. A single NDVI number for a whole field is nearly useless. But an NDVI map showing a field with a low-vigor zone in the southwest corner — consistently, over multiple passes — is actionable. That spatial pattern is stable enough across cloud-free passes to identify management zones worth soil sampling or stand counting. The absolute NDVI value matters less than the relative spatial pattern within a field and how that pattern evolves over the season.
Stress event detection. A sudden drop in NDVI between two consecutive cloud-free passes — say, from 0.78 to 0.58 in 10 days — flags a stress event that warrants investigation. The drop could be drought, disease, hail, or equipment damage. NDVI doesn't tell you which; it tells you something happened. That's a useful early warning, especially in the R1–R3 window when stress has the strongest effect on yield.
Where NDVI Misleads You
This is the part that tends to get omitted from satellite platform marketing, and it's important enough that we want to be explicit. NDVI has real limitations that make it the wrong primary signal for certain applications.
Saturation at high biomass. NDVI saturates — becomes insensitive to further canopy changes — once LAI (leaf area index) exceeds roughly 3–4. For a dense corn canopy at R1 in a good year, LAI can reach 5–6. Once you're in saturation territory, NDVI can't distinguish between a field yielding 200 bu/ac and one yielding 180 bu/ac. Both look the same at 0.83. This is the single most important practical limitation for yield forecasting: the exact conditions where you most want discrimination — peak biomass at silking — are precisely where NDVI saturates and loses sensitivity.
Soil background interference early in the season. Before canopy closure, bare soil between rows contributes meaningfully to the pixel-averaged reflectance. A field at V4 with 30-inch row spacing will have a lower NDVI than the same field at V4 planted in 20-inch rows, even with identical plant populations and canopy health. Early-season NDVI comparisons across fields with different row spacings need to account for this effect.
Cloud cover and atmospheric effects. Sentinel-2 imagery includes an L2A product with atmospheric correction applied, but thin cloud cover and high aerosol loads — common in humid Midwest summers — can introduce noise that looks like a real NDVI drop. The standard quality flag mask in S2 removes obvious clouds, but thin cirrus and hazy conditions can slip through. Any NDVI anomaly should be cross-referenced against weather station records before being treated as a crop stress event.
Better Indices for Specific Applications
For the saturation problem at high LAI, NDRE (Normalized Difference Red Edge Index) performs considerably better. NDRE uses Sentinel-2 Band 5 (red-edge, 705 nm) instead of the red band: (NIR − Red-Edge) / (NIR + Red-Edge). Red-edge reflectance is less affected by chlorophyll saturation and continues to respond to biomass variation at higher LAI values. The tradeoff is that Band 5 is at 20m resolution, versus 10m for the red band used in NDVI. For fields smaller than ~5 hectares, that resolution difference matters. For 160-acre quarter sections in the Midwest, it generally doesn't.
EVI (Enhanced Vegetation Index) adds a soil adjustment factor and a blue-band correction term, reducing soil background effects and atmospheric interference. It's more computationally demanding to derive and requires Band 2 (blue) data, but it's the preferred index for early-season monitoring before canopy closure in many research applications. We use a blend: NDVI for spatial pattern mapping during early canopy development, with a switch to NDRE for peak-season biomass indexing once LAI exceeds a threshold we estimate from the NDVI trajectory itself.
A Practical Example: Story County, Iowa — 2023
In our 2023 season dataset, a group of fields in central Story County had peak NDVI values that were nearly identical across a cluster of fields — all showing 0.81–0.84 on the late-July imagery pass. The NDVI signals told us these fields were all healthy, fully canopied, and in similar condition. The final combine averages ranged from 171 to 208 bu/ac across those same fields.
The 37 bu/ac spread wasn't visible in NDVI. It showed up in the NDRE-derived biomass index, in the GDD-weighted canopy closure timing (earlier closures correlated with higher final yields), and in the sub-field soil texture maps — the high-yield fields had predominantly silt loam profiles; the lower-yield fields had more clay-heavy spots. NDVI was telling us all those fields were green and dense. It wasn't wrong — they were. But it wasn't telling us what mattered for yield prediction.
We're not saying NDVI is a bad signal. We're saying it's a mid-season health screener, not a yield forecasting engine on its own. The growers who get the most out of satellite data are the ones who understand what each signal is measuring and what its limits are — not the ones who treat a single index value as an authoritative field score.
How We Use Satellite Indices Inside the Model
In our yield forecast pipeline, NDVI and NDRE are inputs to the crop growth model, not outputs. The satellite indices are processed alongside GDD accumulation, soil moisture estimates derived from weather station data and soil texture, and reported precipitation. The model uses the canopy closure timing derived from the NDVI time series to initialize the LAI trajectory, then tracks that trajectory against GDD-expected phenological stages.
The specific phenological anchors for corn that we track in the model: V6 emergence confirmation (NDVI rising steeply), estimated canopy closure (NDVI plateau), VT/R1 (NDVI at or near peak, NDRE still sensitive), R3 (NDRE beginning to differentiate yield-potential gradients), and early senescence onset at R5–R6. The lag between satellite overpass and processed product availability means some phenological events are inferred retroactively rather than detected in real time — the 5-day revisit is theoretical, and cloud cover reduces practical clear-sky frequency in the Midwest to roughly 8–12 passes per growing season in a typical year.
That's why the model doesn't run on satellite data alone. Weather-derived inputs fill the gaps between clear-sky passes, and soil-based parameters anchor the baseline in a way that satellite reflectance alone can't provide. The satellite tells you what happened to the canopy. The weather data tells you why. The soil tells you what the field's capacity is in the first place.