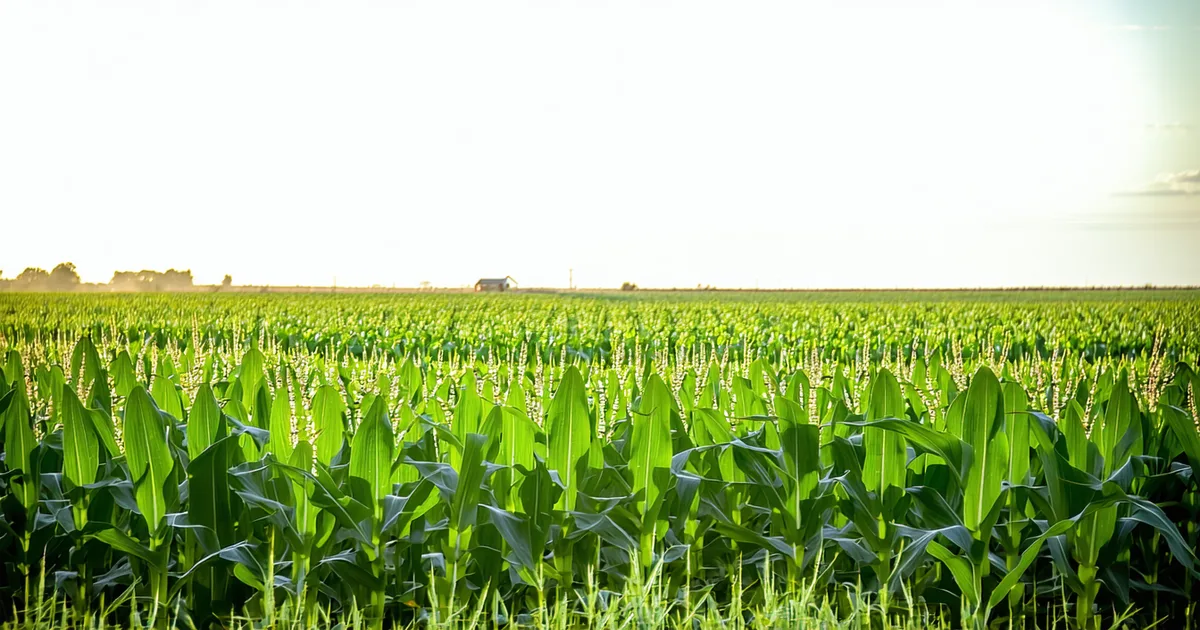
Why Pollination Is the Irreducible Vulnerability
Corn pollen viability is highly temperature-sensitive. Viable pollen germinates on the silk, grows down the silk channel, and fertilizes the ovule at the base of each potential kernel site. The process requires roughly 24 hours from pollen shed to fertilization. Temperatures above 95°F (35°C) during active pollen shed begin to desiccate pollen and reduce viability. Above 104°F (40°C), pollen viability drops sharply — field research at land-grant institutions has documented germination rates falling below 50% in air temperatures exceeding 38°C for more than a few hours.
The timing constraint makes this a narrow but consequential window. VT (tassel emergence through full pollen shed) typically spans 7–14 days, depending on hybrid and weather conditions. R1 (silk emergence) ideally overlaps with the last 3–4 days of VT. Heat stress that lands precisely in the VT–R1 overlap window reduces fertilization success in a way that cannot be compensated later in the season. A kernel site that doesn't get fertilized doesn't fill — it becomes a blank on the cob. The resulting yield loss is yield potential that was set during vegetative growth but could not be realized because pollination failed.
This is why the timing of a heat event within the season matters more than its intensity alone. A week of 98°F temperatures in mid-August, when corn is at R4 (dough stage), is uncomfortable for yield but not catastrophic — the kernels are already set and partially filled. The same week occurring at VT–R1, when pollen is actively shedding, can cause 15–30% yield loss on susceptible fields.
The 2024 Midwest Heat Event
In late June through early July 2024, a persistent heat dome settled over the central Corn Belt. Daily maximum temperatures in parts of central Iowa, northern Illinois, and southern Minnesota exceeded 95°F for 8–11 consecutive days — landing squarely on the VT–R1 window for fields planted in early-to-mid May. The timing was near worst-case: late-May plantings in Iowa were entering VT approximately June 22–26; early-June plantings in Minnesota were entering VT July 2–8. The heat event ran from approximately June 25 through July 5.
Fields in the affected geography that had planting dates aligning their VT window with June 28–July 2 — roughly a 5-day target window within a 10-day heat event — showed the highest predicted yield drag in our heat-stress model. Fields that had either earlier or later planting dates were partially outside the worst heat window during their active pollination period.
In our field set for 2024 (predominantly Iowa and Nebraska, with some Kansas fields added mid-season), we identified 43 corn fields that met the criteria for "pollination heat stress" — defined as at least 4 consecutive days with maximum temperature exceeding 95°F during the field's estimated VT–R1 window, based on CIMIS weather station data interpolated to each field centroid.
How the Heat-Stress Index Works
Our heat-stress index runs as a penalty modifier on the standard GDD-based yield trajectory. The GDD model (base 50°F, cap 86°F) calculates accumulated heat units as the driver of crop development and potential biomass accumulation. The cap at 86°F is standard — temperatures above 86°F do not contribute positively to corn development, which is why the GDD accumulation formula doesn't count anything above the upper threshold. But that cap doesn't account for the active damage that occurs above 95°F during pollination. That requires a separate heat-injury term.
We compute a daily heat-injury accumulation above 95°F — essentially a degree-day calculation above the damage threshold, analogous to how GDD is computed above the base temperature. This heat-injury accumulation is then weighted by a pollination sensitivity coefficient that peaks during VT–R1 and falls off rapidly after R1 (once pollination is complete, heat stress affects kernel fill but with considerably less severity). The final yield forecast during and after a heat event is: base forecast × (1 − pollination_injury_modifier).
Calibrating the modifier required drawing on published stress-response relationships from university trial data rather than proprietary benchmarks we don't have. We're not claiming to have derived these relationships from scratch — the physiological work is published and accessible. Our contribution is applying it in a field-by-field, event-specific way using real-time weather data rather than historical averages.
What the 2024 Data Showed
For the 43 heat-stressed fields in our 2024 set, post-harvest validation became available through the fall. Across those fields, the heat-stress-adjusted forecast showed a mean absolute error of 11.3 bu/ac against final combine yields — comparable to our non-stressed field accuracy. More importantly, the directional prediction was correct: every field where our heat-stress modifier predicted >15% yield drag did show a below-expected yield relative to the county NASS average and relative to our un-adjusted baseline.
The average predicted yield drag for heat-stressed fields versus our pre-event baseline forecast was 18.4 bu/ac, ranging from 9 bu/ac on fields at the edge of the heat window to 31 bu/ac on fields with peak pollination alignment with the hottest days. The actual observed drop (comparing heat-stressed fields to similar non-stressed fields in the same county) was 16.2 bu/ac average — within 2.2 bu/ac of the model prediction on average.
We're not saying the model perfectly captured every field's loss — individual field error ranged from 4 to 27 bu/ac. But the aggregate directional signal was reliable enough that the updated mid-season forecasts reflected reality rather than perpetuating a pre-event baseline that would have been badly wrong.
Fields That Beat the Heat Stress Prediction
Eight of the 43 heat-stressed fields outperformed the heat-adjusted forecast by more than 10 bu/ac. Reviewing those fields, three patterns were common. First, several were on heavier clay soils with higher water-holding capacity — soil moisture buffers canopy temperature somewhat, and adequate soil moisture at the root zone during a heat event can reduce the canopy temperature relative to air temperature by 2–4°F, keeping pollen temperatures somewhat below the damage threshold. Second, two fields had irrigation systems that ran continuously during the heat event, further buffering canopy temperature. Third, two fields had late-planted corn whose VT window shifted 3–4 days later, narrowly missing the worst heat days.
The irrigation and soil moisture effects weren't fully captured in the 2024 version of the heat-stress model. Post-season, we've added a soil moisture buffer term that reduces the heat-injury accumulation on fields where estimated soil water status during the event was above 60% of field capacity. That adjustment is in the 2025 model.
Implications for Crop Insurance and Loss Reporting
Heat stress losses during pollination are among the more difficult to document for crop insurance purposes. Unlike hail damage, which leaves obvious physical evidence, heat stress damage produces a yield below expectation with no visible canopy symptom after the event. Silks that weren't fertilized look similar to a field with normal fertilization success until the ear fill period reveals the blanked kernel rows.
For growers filing NAP (Non-Insured Crop Disaster Assistance Program) or crop insurance loss claims following a heat event, the RMA loss adjustment process typically relies on APH yield comparison. A field-level pre-event yield forecast, coupled with documented weather station data showing the heat event timing and duration, provides context for the loss that pure APH comparison can't supply. A grower whose APH guarantee is 185 bu/ac but whose yield model projected 195 bu/ac for that specific field in that specific season — before the heat event shifted the forecast to 168 bu/ac — has a stronger evidentiary picture of the loss than APH alone.
We've had growers share post-harvest loss documentation with us specifically for this reason. We don't perform loss adjustments — that's the adjuster's role — but the field-level pre- and post-event forecasts are a record that growers own and can bring to that conversation.
What Changes for Heat Stress Management Going Forward
Heat events during pollination are not manageable the same way nitrogen or water stress can be managed. You cannot irrigate away a 100°F day's effect on pollen viability, and you cannot apply a fungicide against heat. The only agronomic levers available are: hybrid selection (late-pollen-shed hybrids, or hybrids with documented heat tolerance in silking trials), planting date adjustments (shift VT timing earlier or later to reduce overlap probability with peak heat periods), and irrigation scheduling to maintain canopy moisture buffer.
Planting date optimization for heat avoidance during pollination is gaining interest in Iowa and Illinois extension circles. Given that the standard planting window in central Iowa spans April 25 through May 20, and VT typically occurs 70–80 days after planting for typical hybrid maturities, the VT window covers a range of roughly July 3–August 8 depending on planting date. Statistically, late-June through mid-July carries the highest probability of heat events in the central Corn Belt. This doesn't mean early planting is always better — cold soil stress at planting has its own yield drag — but the heat exposure calculus is worth including in planting date decisions in heat-risk geographies.